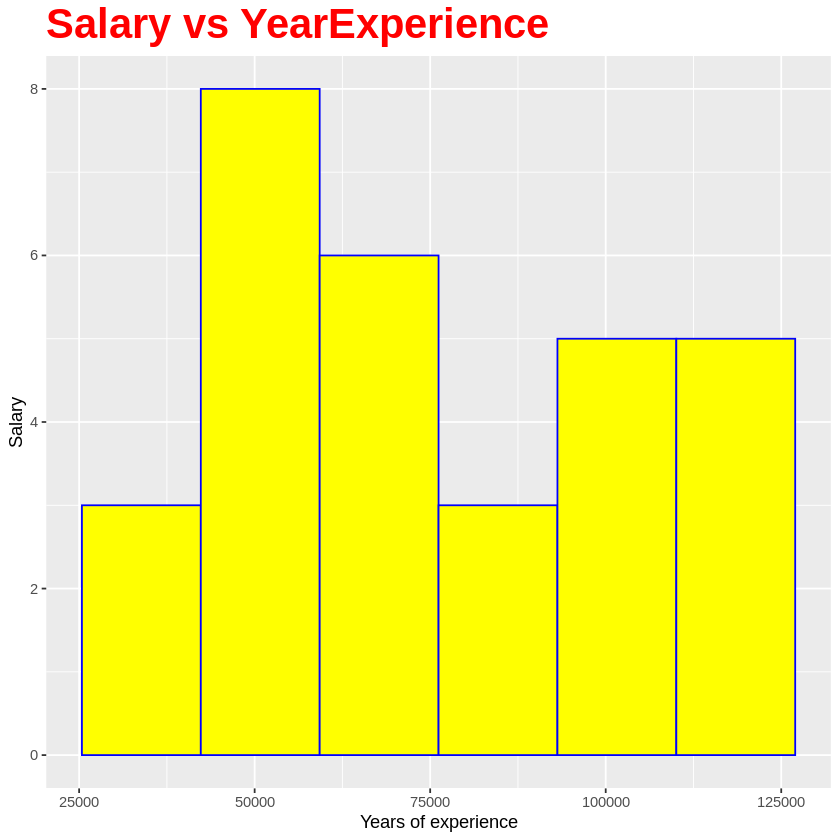
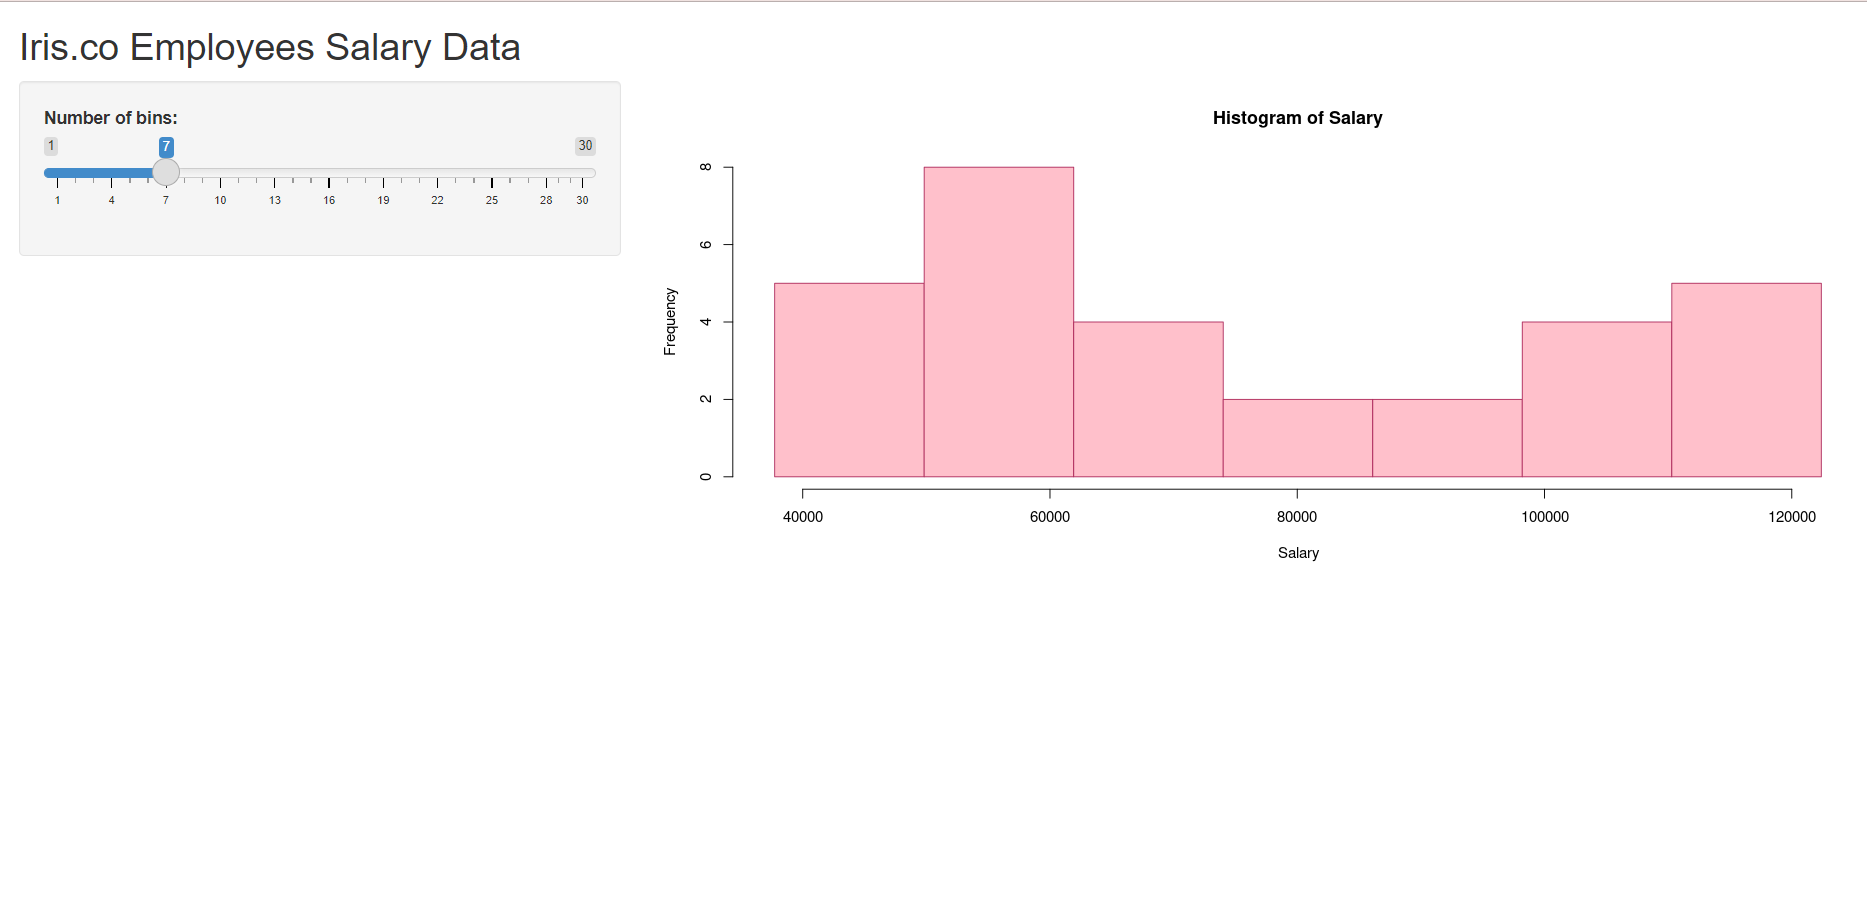
Hi, we are from Iris Group. Our dataset is about the salary of 30 employees in our company. After analyzing and exploring the data, we used a histogram to visualize the data. For the ML algorithm, we chose Simple Linear Regression as our data only consist of 1 input, 1 output, and both column in continuous numerical data.
To view the histogram:
To view the RShiny App:
Group members:
Noor Anis Nabilla Binti Ismail
Nursyafiqah Sharmeen Binti Hussin
Ummilia Balqis Binti Harun

Thank you for teaching us, Dr.Sara. We really enjoyed the course and learned a lot of new knowledge! ")