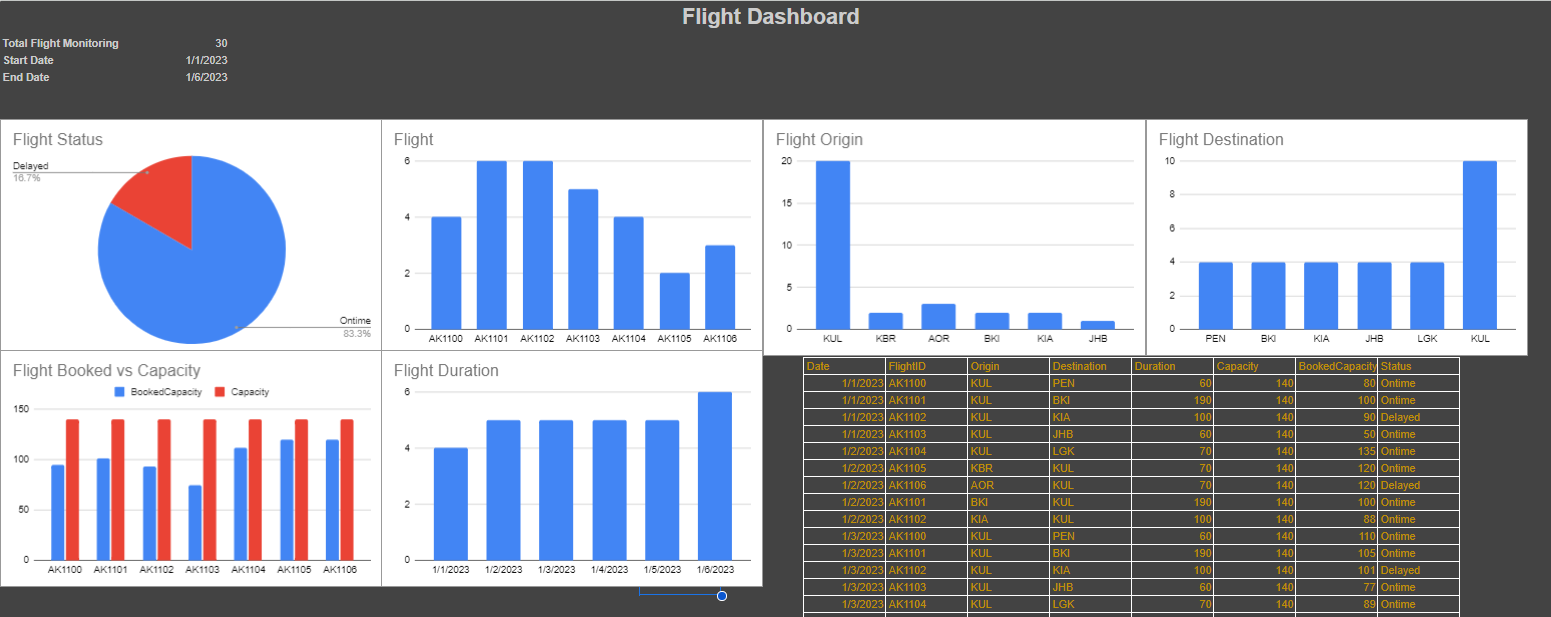
Hi, please share your Looker Studio URL here.
Example:
https://lookerstudio.google.com/reporting/1491dcec-5502-455a-bc4d-51141374e75b
Hi, please share your Looker Studio URL here.
Example:
https://lookerstudio.google.com/reporting/1491dcec-5502-455a-bc4d-51141374e75b
@rasyidah Hi! Nice work. Can you share your web URL?
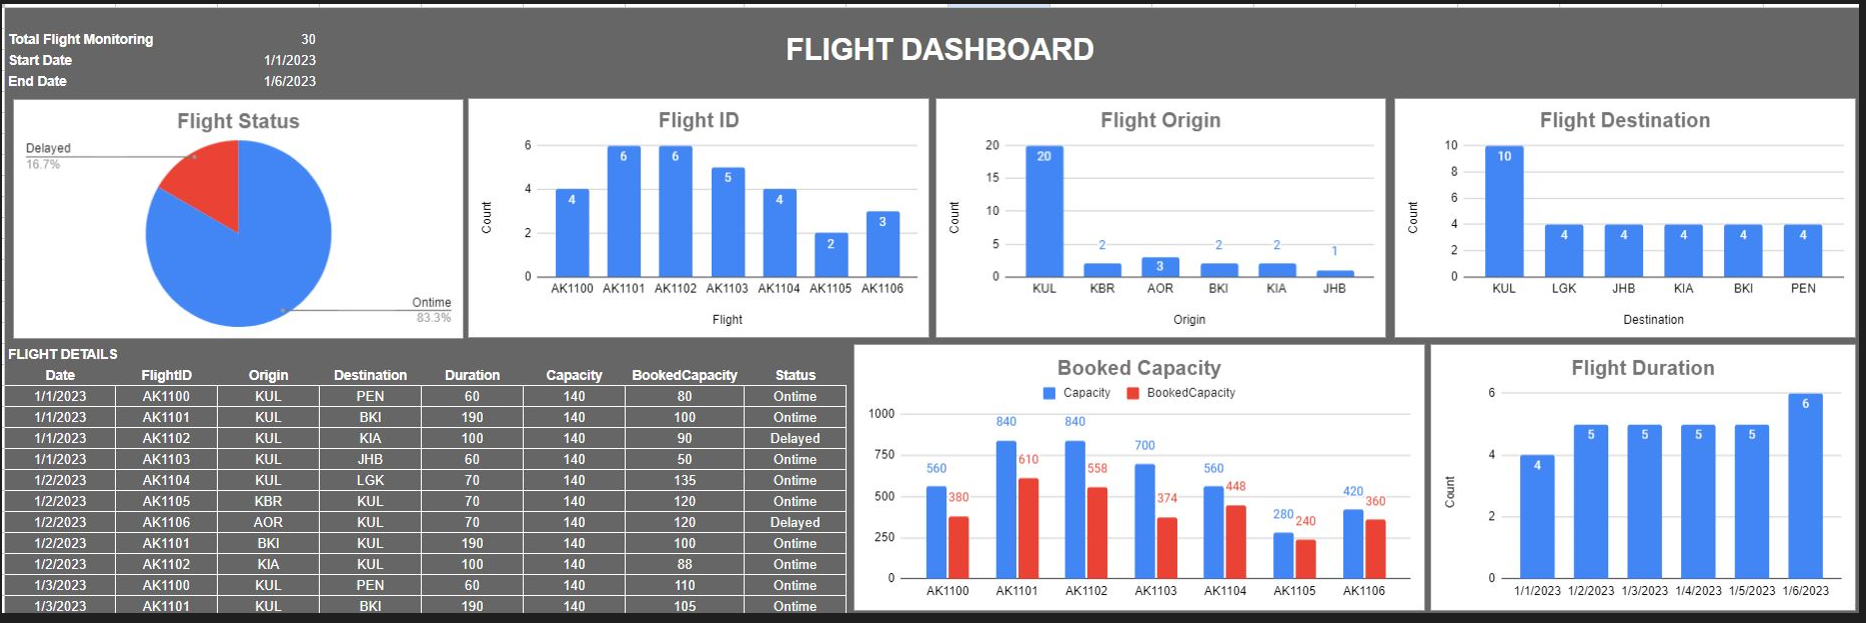
Hi, do you know that you can develop a dashboard using Google Sheet? It is simple, and zero code required!
Hi, we would love to see the screenshots of your Google Sites Machine Learning portfolio here.
Hi, kindly share your findings here.
@zikrihayat456 said in Prediction Results - Supervised Learning using Python - Classification:

Hi, kindly recheck your samples and confusion matrix.
@haziqjefry26 Hi, can you please recheck your accuracy.
Hi,
Kindly share your finding for Supervised Learning algorithms applied for classification problem discussed in class.
Submission Exercise 7 (https://forms.gle/Ru5DQJq2GCYkX3fx9)
Python is simple to learn and it is one of the most powerful programming languages that used in various areas such as web or software development, data analytics, and machine learning.
Check out the case study of sales from Data Analytics Using Google Sheets - A Case Study of Sales
Streamlit is one of the web application tools that can support Python codes and can perform prediction based on the codes written.
What is the other platform that you use in AI web application? Share your experience.
Python has become one of the most popular programming languages for data analytics and data science due to its versatility, extensive libraries, and an active community of users and developers. Here's how Python is used in data analytics:
Data Cleaning and Preprocessing: Python, along with libraries like Pandas and NumPy, is widely used for data cleaning and preprocessing tasks. You can handle missing data, remove duplicates, and reformat data to make it suitable for analysis.
Data Visualization: Python offers various libraries for data visualization, such as Matplotlib, Seaborn, Plotly, and Bokeh. These libraries allow you to create a wide range of visualizations, from basic charts to complex interactive dashboards.
Statistical Analysis: Python's SciPy library provides a wide range of statistical functions and tests. You can perform hypothesis testing, regression analysis, and more to extract insights from your data.
Python's popularity in the field of data analytics is driven by its ease of use, a vast ecosystem of libraries, and a strong community of developers. It is the language of choice for many data analysts and data scientists for its ability to handle a wide range of tasks throughout the data analytics pipeline.
Google Sheets is a versatile spreadsheet tool that can be useful in various aspects of data analytics. While it may not be as powerful as dedicated data analysis tools like Excel or more specialized software like R or Python with data analysis libraries, Google Sheets offers several features that can aid in data analytics tasks. Here are some ways Google Sheets can be used in data analytics:
Data Entry and Storage: Google Sheets is a convenient platform for data entry, storage, and organization. You can create spreadsheets to store raw data, datasets, or import data from various sources.
Data Cleaning and Preparation: You can perform basic data cleaning tasks such as removing duplicates, filling missing values, and formatting data in Google Sheets.
Data Visualization: Google Sheets offers various charting tools, including bar charts, line graphs, scatter plots, and pie charts, to visualize data trends and patterns.
Descriptive Statistics: Calculate basic descriptive statistics like mean, median, mode, standard deviation, and variance using built-in functions in Google Sheets.
Filtering and Sorting: Use filters and sorting options to explore and analyze data subsets quickly, helping you identify patterns or outliers.
Pivot Tables: Pivot tables in Google Sheets allow you to summarize and aggregate data, providing insights into your dataset's structure.
Formulas and Functions: Google Sheets supports various mathematical and statistical functions, making it possible to perform calculations on your data.
Data Import: You can import data from external sources such as web pages, CSV files, and databases, and use Google Sheets as a data integration tool.
Collaboration: Google Sheets is designed for collaborative work, allowing multiple users to edit and view a spreadsheet simultaneously. This is especially useful for team-based data analysis projects.
Add-Ons and Scripting: Google Sheets offers add-ons and scripting capabilities that enable you to extend its functionality. You can write custom scripts in Google Apps Script to automate tasks or create custom functions.
Data Sharing: Share your Google Sheets with others and control their level of access. You can also embed sheets in websites or share them as interactive dashboards.
Integration with Other Tools: Google Sheets can be integrated with other Google Workspace apps like Google Data Studio, Google Analytics, and Google BigQuery to enhance your data analytics capabilities.
While Google Sheets is suitable for basic data analytics tasks and smaller datasets, it may not be the best choice for handling very large or complex datasets. In such cases, more specialized data analytics tools like Python with libraries like Pandas, R, or dedicated data analysis software like Excel may be more appropriate. However, Google Sheets can still be a valuable part of your data analytics toolkit, especially for quick data exploration, collaboration, and sharing insights.