Please share your experience in completing your mini project in R using google Colab and R Shiny.
Data Analysis using R -YAYASAN BATCH 5
I have about the R programming and what is about data analytics. Overall, it is a very good experience with Dr Sara because the way she explained was very detailed in every chapter of R Programming. We can extract the data and plot the data in the visual chart or graphs so that we can see the trend of the data.
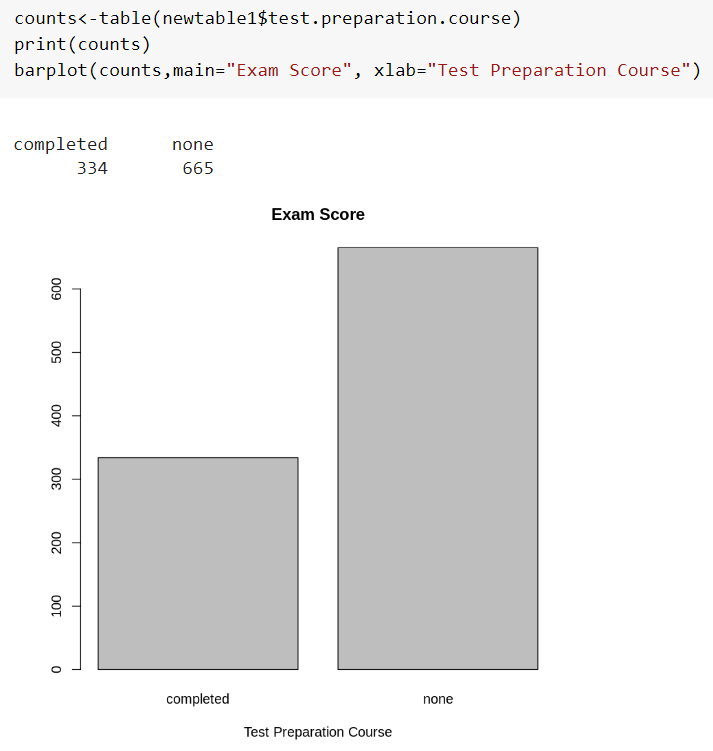
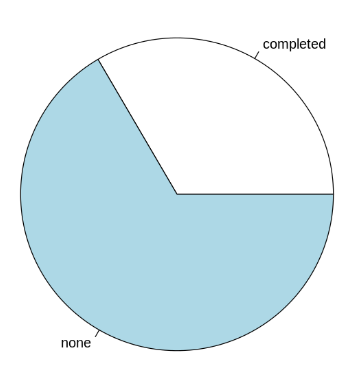
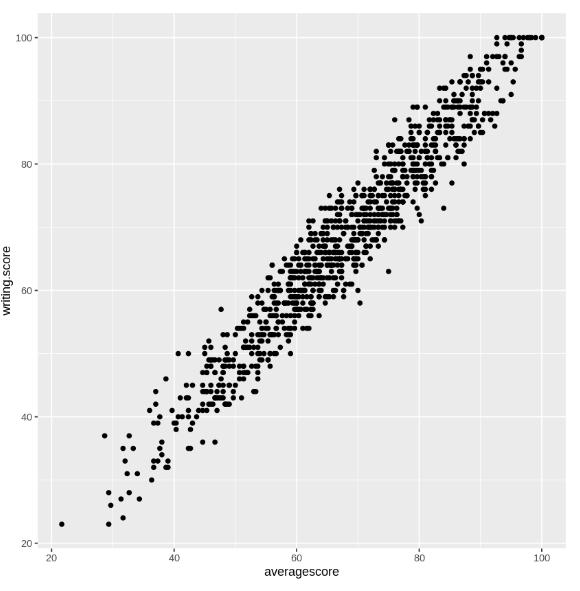
A very challenging course for a beginner with well explanation lecturer. The supporting material provided all training and tutorial for participants with full knowledge. Working on a challenging 5 days face to face course was meaningful and will be remembered.
This is my work for to show visualization:
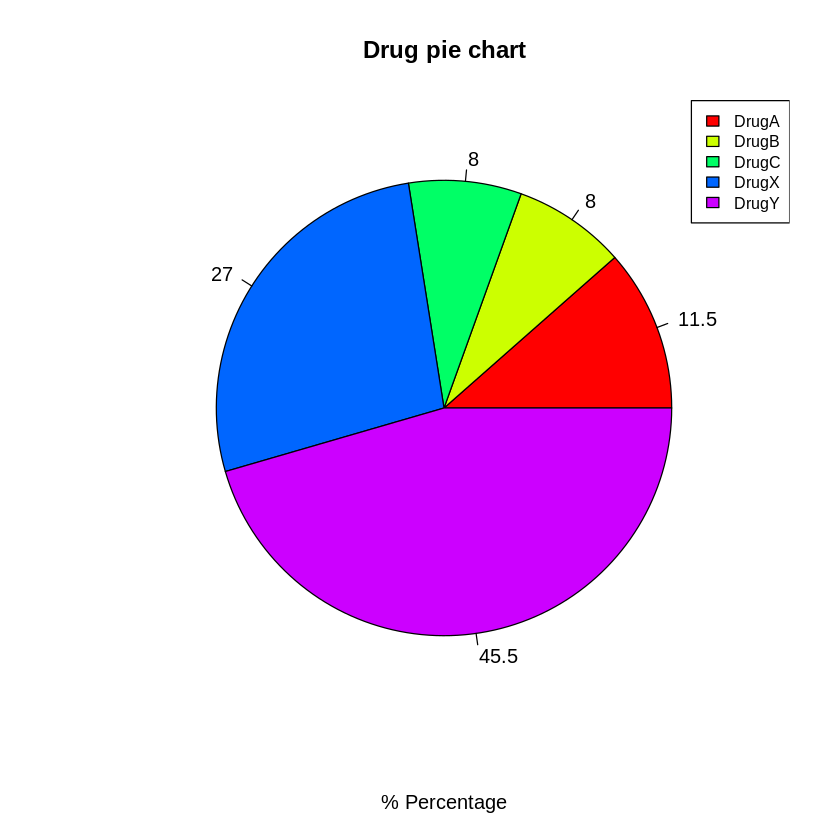
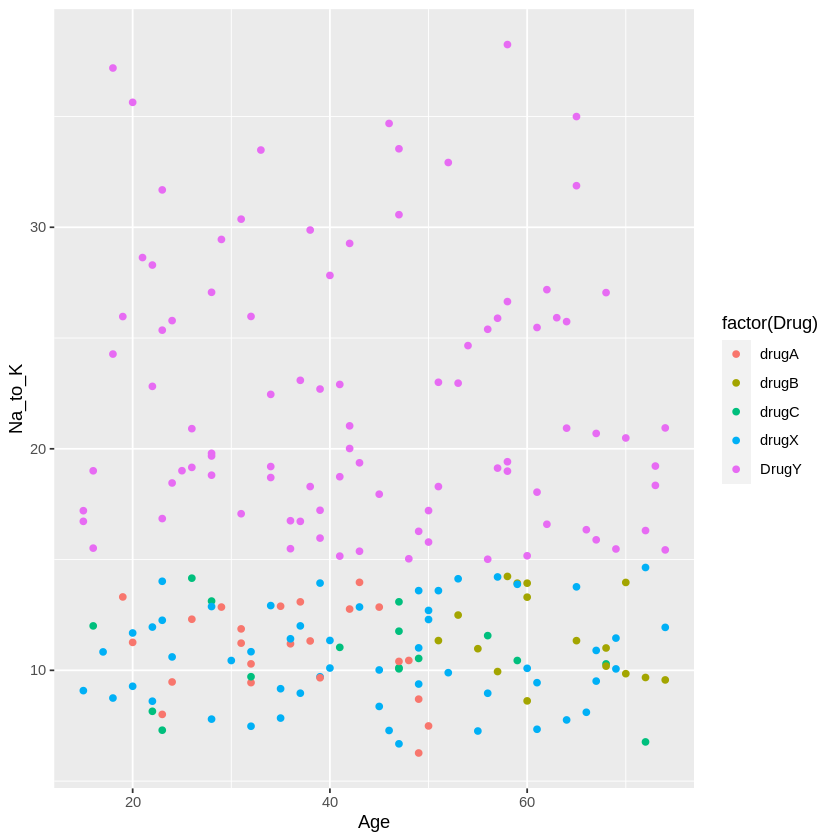 image URL)
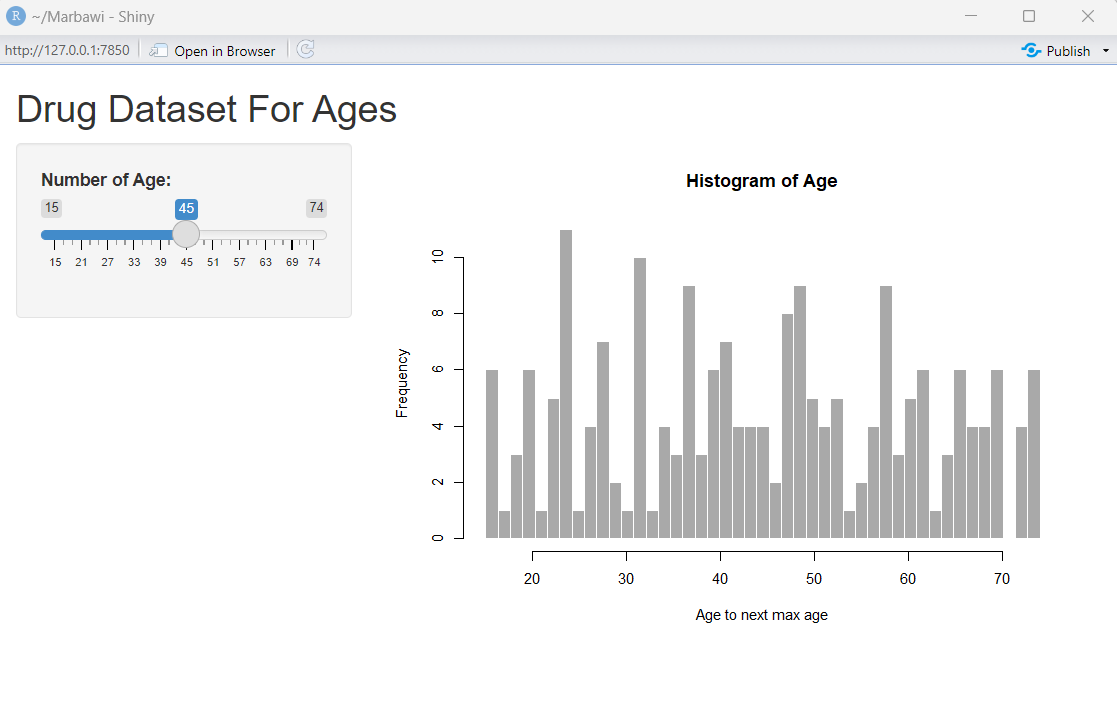 image url)
Once I started learning tools for data manipulation and visualization like dplyr and ggplot, this course gives a chance to use them in action on a real dataset. It is good explanation from Dr Sara which she explain this course very detail one by one and thankyou for giving me a new world about data analytics.
It was an amazing experience to start learning from beginners to completion of the program syllabus that expose about the basic of knowledge in R programming and data analytics.
First of all, im not very experience with data analytic but with the way Dr Sara teach and explain about R Progamming very detailed. At the end i got learn so many information
im zero knowledge about IT, Data Analytic and im verry-verry interested what im learn from Dr Sara. That's all about Data Analytic. So many benefit i get from Dr Sara in a short week, tq for all to support me. Especially Dr Sara
im learning how to collecting, cleaning, manipulating, Analyzing,Visualizing data and im verry interested is about R-Studio!