Last but not least, thank you for everything Dr. Sara! Take care and stay safe 
0
Reputation
2
Posts
1
Profile views
0
Followers
0
Following
Best posts made by adilatsara
This user does not have any upvoted posts yet.
Latest posts made by adilatsara
RE: Projects on Data Analytics Using R
posted in Data Analytics •
RE: Projects on Data Analytics Using R
posted in Data Analytics •
Hi! We are from Pfyzer Group. Our findings on analyzing the various real time Datasets of Covid-19 Live cases.
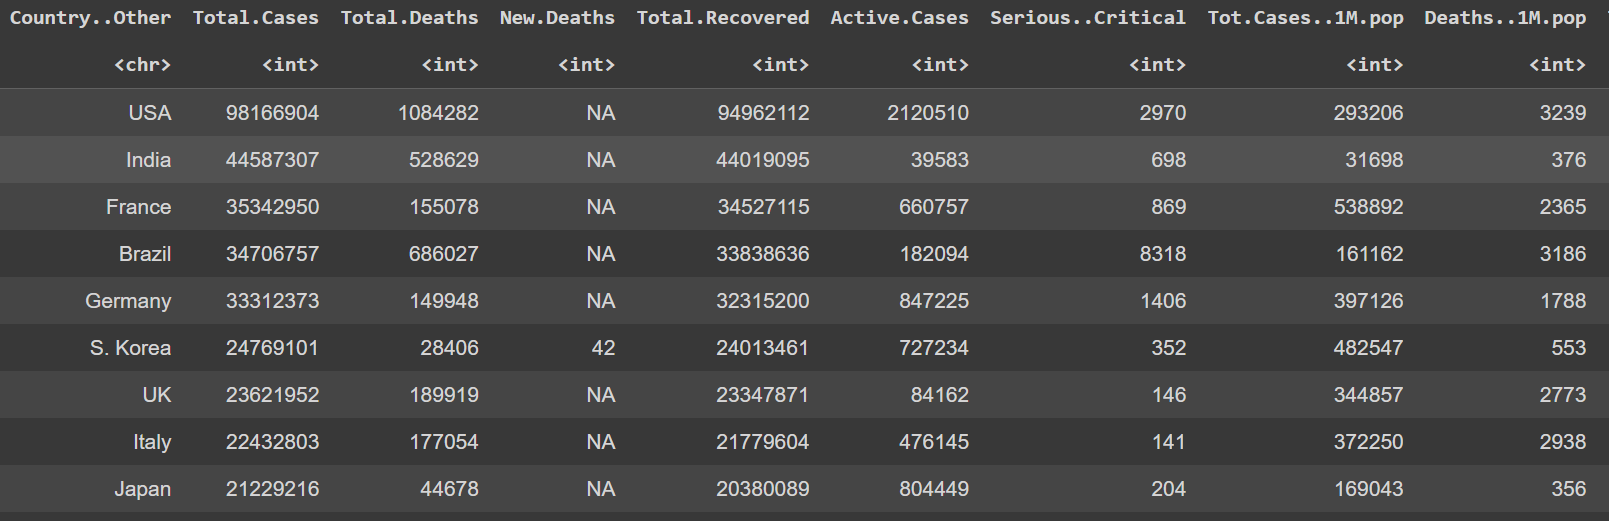
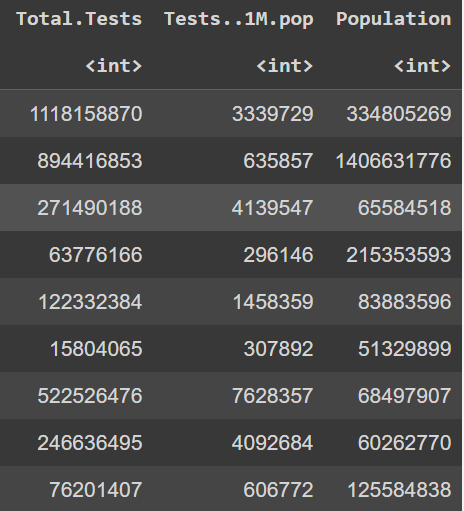
- Our data is about the prediction of Covid-19 total cases. The total cases of Covid-19 including the active cases, total death and total recovered all around the world. As following below shown the data frame of 230 rows and 12 columns:
- We visualize our data by using Box plot GG plot such as Bar Chart, Lollipop Chart, Line Plot and Scatter Plot. Below is one of the example for the chart:
Lollipop Chart
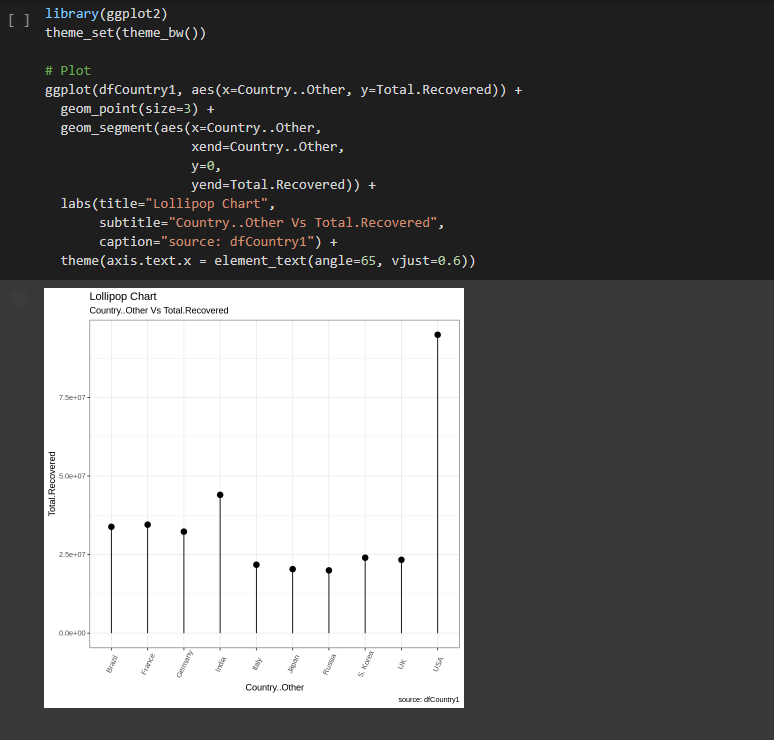
Observation: The United States of America (USA) has the highest total recovered of Covid-19 cases among the top ten countries analysed.
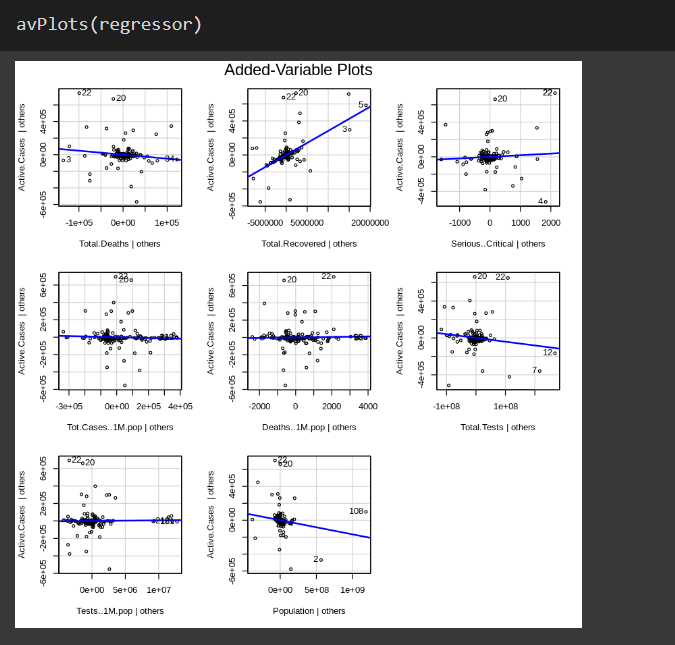
- Machine Learning algorithm that we used for analyzing our data is Multiple Linear Regression. The reason why we used the Multiple Linear Regression is because the data are more than one independent variable and one dependent variable are present. Simply we can say that when the data frame have more than one input and has one output of numerical data. Visualize the results is shown below: