@saranyaravikumar
The dataset is on brain stroke prediction.
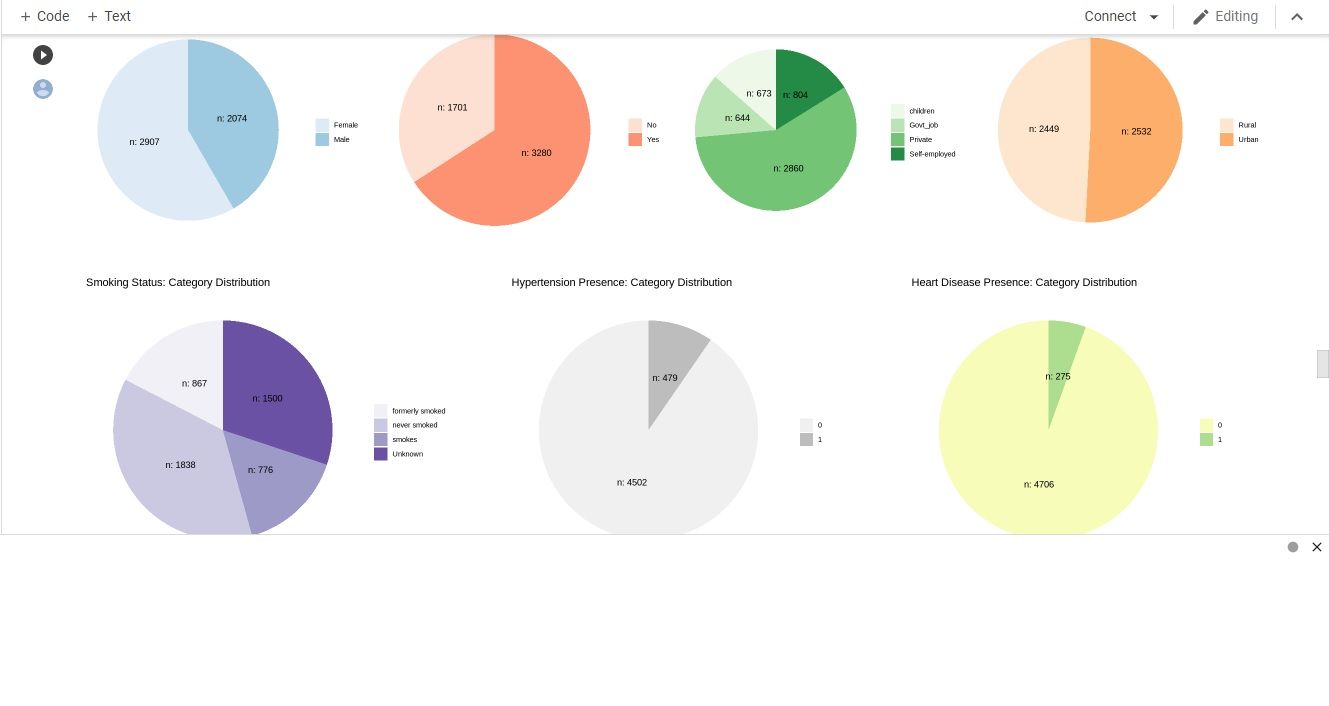
Next, we visualize the data using pie chart to see the proportion of stroke among the categorical data.
For ML algorithm, we chose to use logistic regression, decision tree and KNN. The reason why is, the data is too limited to make a solid conclusion. It does not represent the whole population.
You can view the codes on Google Colab
0
Reputation
1
Posts
1
Profile views
0
Followers
0
Following
Best posts made by aynafrina
This user does not have any upvoted posts yet.
Latest posts made by aynafrina
RE: Projects on Data Analytics Using R
posted in Data Analytics •