Our data is about the treaments using 5 types of drugs.
To analyse the data we employed ggplot2 packages that available in the R programming language. The data is used to find which drug is better for patient that have different level of blood pressure and cholesterol level.
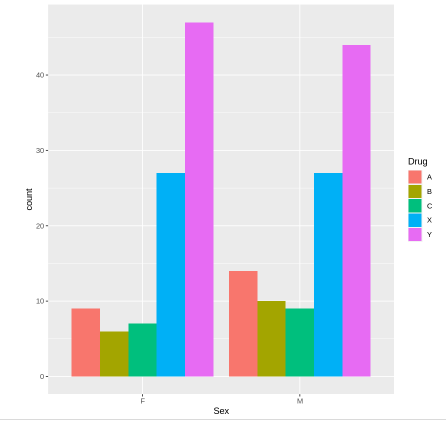
The histogram below shows the relationship between the age and the types of drugs. Our finding is that the drugs have almost similiar proportions between sexes.
The ML algorithm used is supervised (Classification-Decision Tree) because the target is categorical type of dataset.
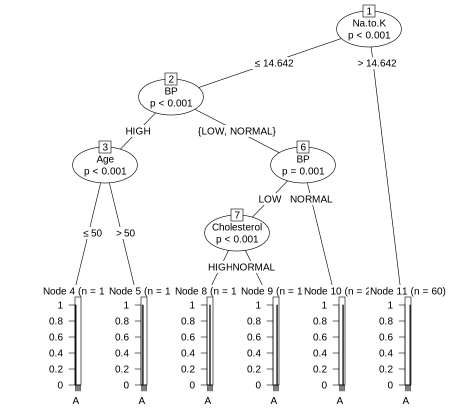
We can conclude that Drug A plays more important role compared to other drugs.
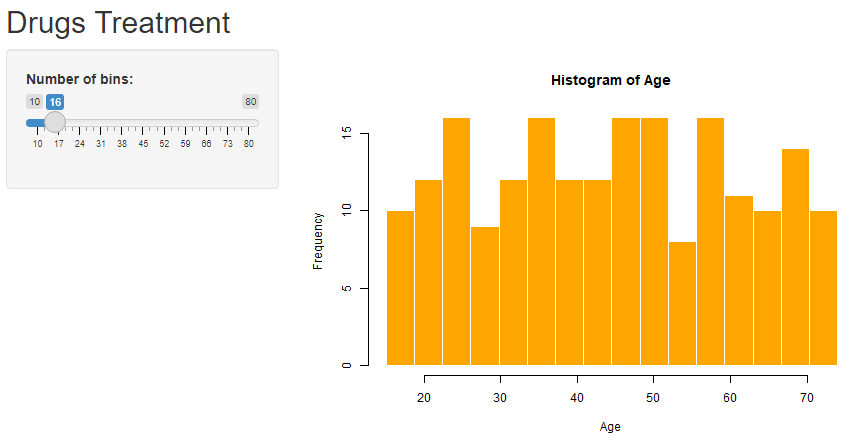
Here, we also plot a histogram for the patient's age used in this observation. The histogram is plotted using R shiny package.