Navigation

    • Register
    • Login
    • Search
    • Recent
    • Users
    • Groups
    1. Home
    2. nuramirahm07
    N

    nuramirahm07

    @nuramirahm07

    0
    Reputation
    1
    Posts
    1
    Profile views
    0
    Followers
    0
    Following
    Joined Last Online

    • Profile
    • More
      • Following
      • Followers
      • Topics
      • Posts
      • Best
      • Groups
    nuramirahm07 Follow

    Best posts made by nuramirahm07

    This user does not have any upvoted posts yet.

    Latest posts made by nuramirahm07

    RE: Projects on Data Analytics Using R

    Group: HADA
    Dataset: exams

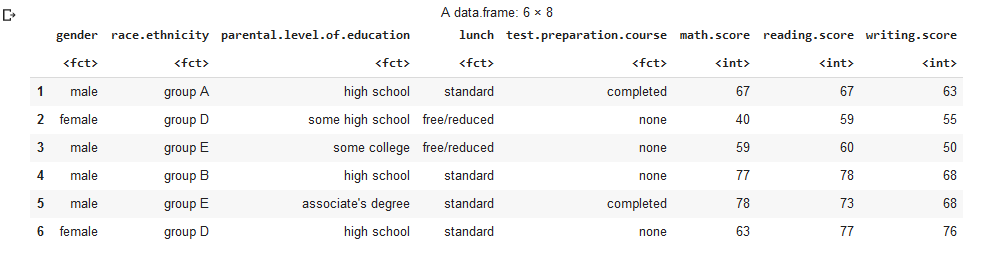
    The data we working out are exams.csv that contains score data for completed tests.

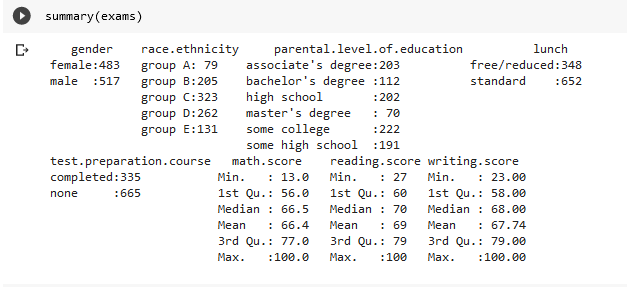
    Understanding the data:

    From data exploration mode, we can define that :
    • gender : gender of the student
    • race.ethnicity : group the student ethnicity as Group A to group F
    • parental.level.of.education : define the parent level of education of students
    • lunch : The type of lunch take by the student
    • test.preparation.course : The status of test prepartion course of the student
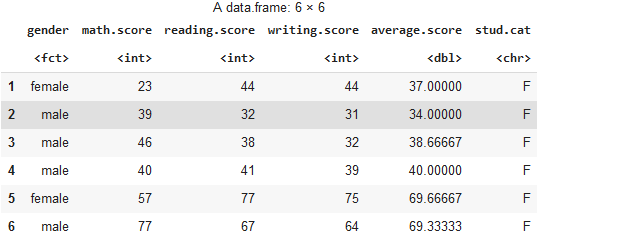
    • math.score : The mathematic test score of the student
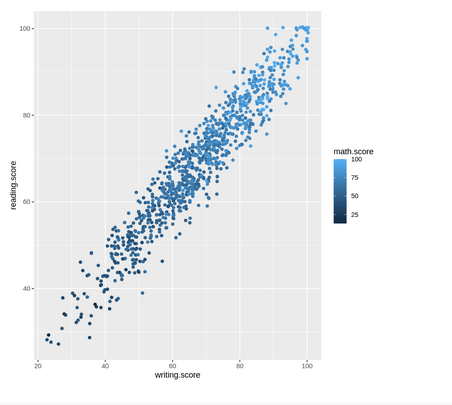
    • reading.score : The reading test score of the student
    • writing.score : The writing test score of the student
    Screenshot 2022-11-07 211811.png

    e5c0cff3-5a6c-4730-a153-a077c667c359-image.png

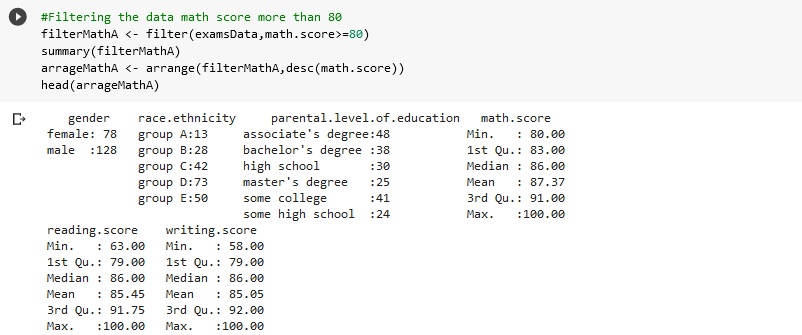
    Data Cleansing & Analysis:
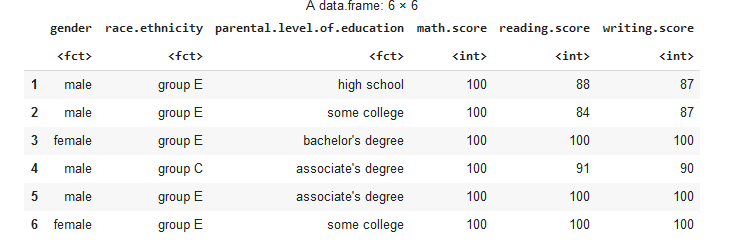
    We filter the data for math.score that more than 80
    Screenshot 2022-11-07 212148.png
    Screenshot 2022-11-07 212340.png

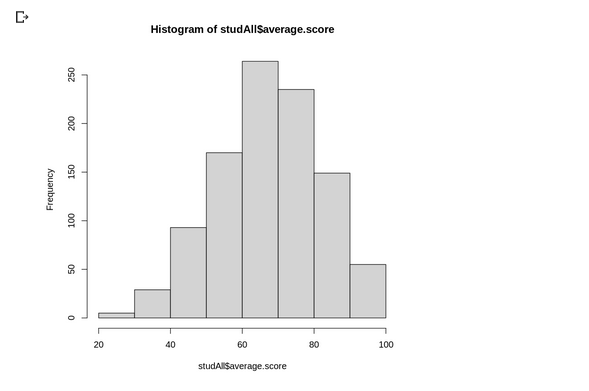
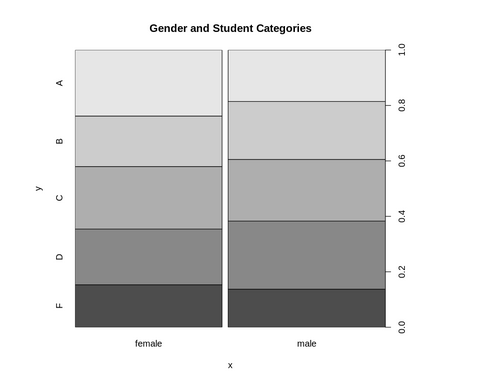
    next, we create new coloumn of average student and their categories based on average score:
    Screenshot 2022-11-07 212705.png

    Machine Learning:
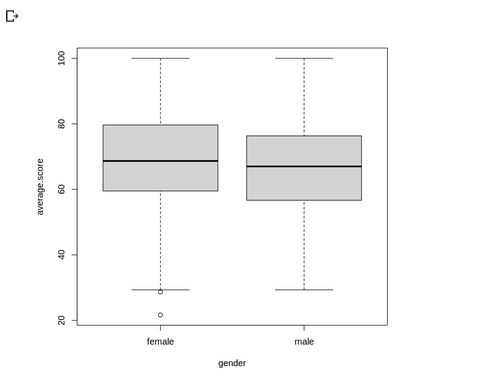
    After analyze and explore the data we visualize the data :
    histogram.png

    graph gender.png

    boxplot.png

    math score.png

    posted in Data Analytics •