Data Analytics Complete Reskill Certificate Program- Yayasan Peneraju(12.12.2023 to 21.12.2023)

๐Ÿš€ Dear Participants, Share Your Data Analytics and R Programming Journey!

Hey Amazing participants,

We've all embarked on this exciting journey into the world of data analytics and programming in R, and each one of us has a unique story to tell. Let's celebrate our successes, conquerings of challenges, and those "aha" moments that made the learning journey memorable.

๐ŸŒŸ Your Experience Matters!

Take a moment to reflect and share your experience. Whether you're a seasoned coder or just starting, your insights can inspire and resonate with others in the team.

  • How did your journey into data analytics and R programming begin?

  • What were the key milestones or challenges you encountered along the way?

  • Share a project or a specific moment that stands out in your learning journey.

  • How has the R community played a role in your learning and growth?

  • Any tips or advice for fellow learners based on your experiences?

Feel free to share your thoughts, anecdotes, and any fun or surprising discoveries you've made. Let's make this space a hub of inspiration and shared learning!

Cheers to our collective journey! ๐Ÿš€๐Ÿ’ป๐Ÿ“Š

Screenshot 2023-12-15 170129.png

I've gained knowledge about R programming and the concept of data analytics. Overall, my experience with Dr. Sara has been excellent because she provided detailed explanations in each chapter of R Programming. We can extract and visualize data using charts or graphs to observe data trends. Initially, I had limited experience with data analytics, but Dr. Sara's detailed teaching has significantly improved my understanding of R Programming. In the end, I've acquired a wealth of information.

Pursuing my studies in Biological science only immersed me more in data as the evolution of Biological field from fundamentals and classical approach to a modern, computerized and data driven approach. ( DNA sequencing , spatial-temporal analysis using GIS).

I regret not learning R sooner as this is a very powerful tools. Learning R programming should not be approached as linguistic language. Learning the fundamental logic in R is adequate enough. With the helps of Instructor, Dr. Sara, which shows her mastery in her field in teaching the logic.

This solid foundation of logic had construct a worldview for me in terms of seeing the world of data. Now , I know what to do.

Screenshot 2023-12-15 at 17-15-39 ChatGPT.png

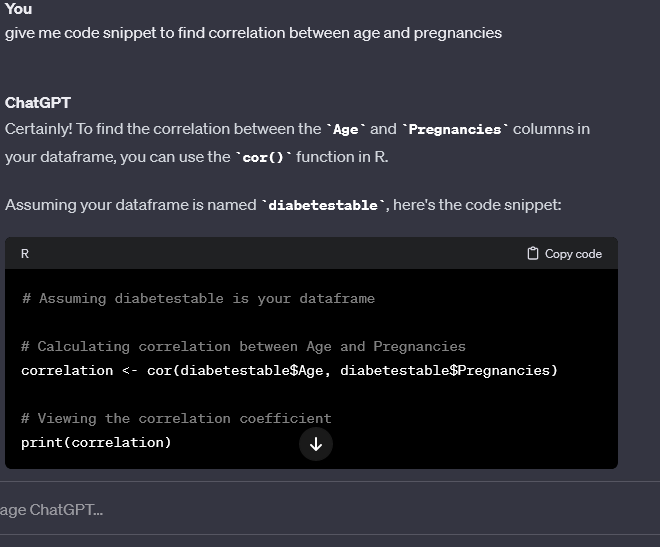
For how to do it , AI ChatGPT can accelerate the learning process.

Untitled.png

One of the most impressive feature in R is the multiple variable that can be cramped in one graph. I would like to try this approach with different dataset to further my understanding in R. As this is an open source language, the community support is very responsive.

For those who aren't familiar in R, just do it. the skills and logics can be applied to any data-driven analysis.

Edreen: With this mini project, we did data analysis for the user trends of Zamato users. To my fellow trainees, if you ever found a better way of processing the data and presenting the visualization, do share. I would love to know the best way to do it. Thank you to Dr. Sara's amazing guidance that helped me find the love to code again.

Alif: Thank you Dr!

Rollie: it was a wonderful journey learning from the expert about data analyst and i am quite enjoy your class. Thank You Dr Sara. you are the best!

Yuki: Thank you Dr Sara for being patient with us. I understand how hard it is to compress a full course education into 4 days. However you did it very well. I really appreciate how you explain everything one by one tediously. Once again, thank you Doctor! You are the best teacher ever!!

Group Yuki: Mini Project

chart 0.png

it begin when I heard from my senior that having knowledge and theory in our degree are not enough to penetrate the market demands. I also want to change my career path because of personal conflict as I want to seek enjoyment and meaning in my career journey.

Before I joined this program, i have zero knowledge in coding. Although i tried to learn beforehand in youtube, its quite hard to memorize all the keywords and hard to understand its purpose. But the most important part that doctor taught us that we should understand of process of data exploring, preprocessing and visualizing.

Im still new in R community and there's a lot of thing I want to explore after the program end. I want to say thanks to Dr for guiding us and entertain our questions although the time are limited.

My advice to fellow learners, never give up. Only by pushing yourself over the limitation and roadblocks in ourself are the only way we can advance further from our starting point in life. And you are not alone in your journey, you have doctor to guide you and friends to assist you so make use the time you have to ask all the question until you understand.Screenshot (20).png

I learn how to differentiate the data , and how to use the different type of graph based on the data we have.

As my first experience in data analytics, it gave me a better understanding of data and helped me make better decisions. Otherwise, through the data analytics, it leads me to learn more about how to understand the data. In this journey, I have better understood how to use numerical and categorical data. Moreover, when R programming begins, it is very challenging for a new beginner, but after going through all the courses and training, it makes me better able to analyse problems, learn how to use data types, and make data visualisations.

As a new beginner, the biggest challenge is understanding how to work with the data. In programming languages and how to plot the code, I need to understand everything from the basic data structure to understanding and cleansing the data. In this way, hands-on learning with the team gives me an overview of how to encounter my challenges.

My team and I had completed the project successfully. The project title is Churn regarding the telecom users that analyse consumer purchase behaviour based on existing customers' states, which are dependent on subscription plan choices.

Teammate Video, Churn in R Programming Project

With all the specific moments, we had to get the data of what happened, which is the output presented through visualisation, diagnostic the data to interprete the reason. All in all, my team and I tried to predicted through forecasting to investigate the specific area, such as West Virginia, that needs optimising the pricing issue regarding charges via plans. Herewith is an example of a project that has been done.

Example of the project (Numerical vs Numerical):-

WhatsApp Image 2023-12-15 at 17.38.47_cdf096ea.jpg

All in all, R programming helps me in clear picture to analyzed and make decision making for future businesses.

From this course, I have learned how to better understand my data and also start my journey on learning data analysis while also using R programming and google sheet to handle them.

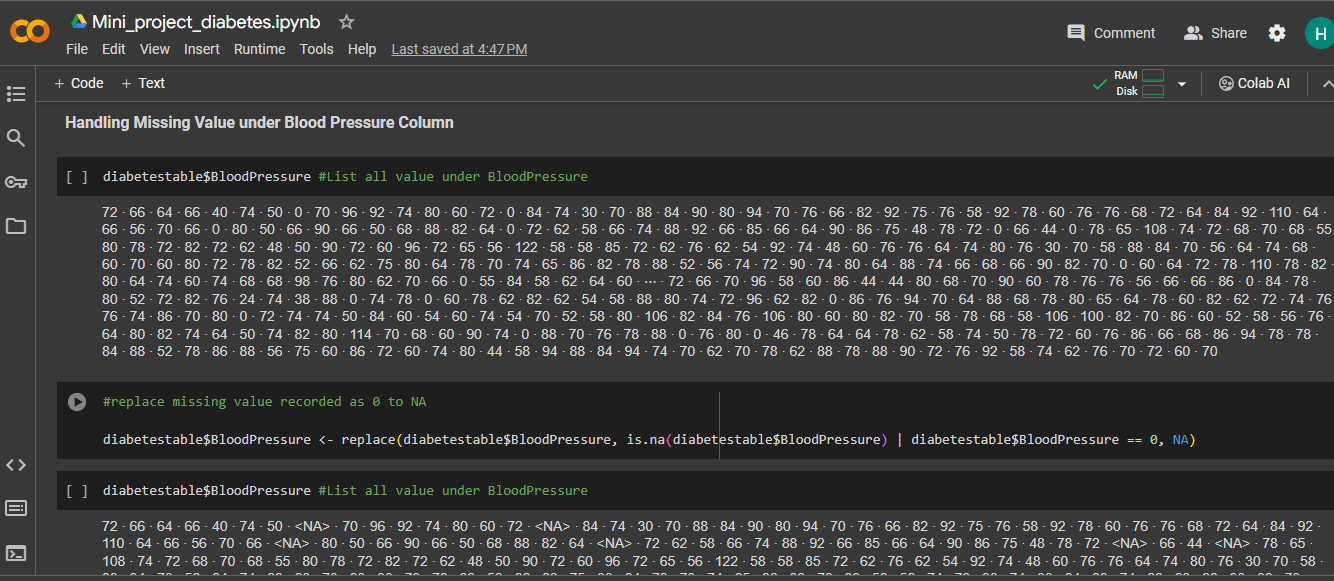
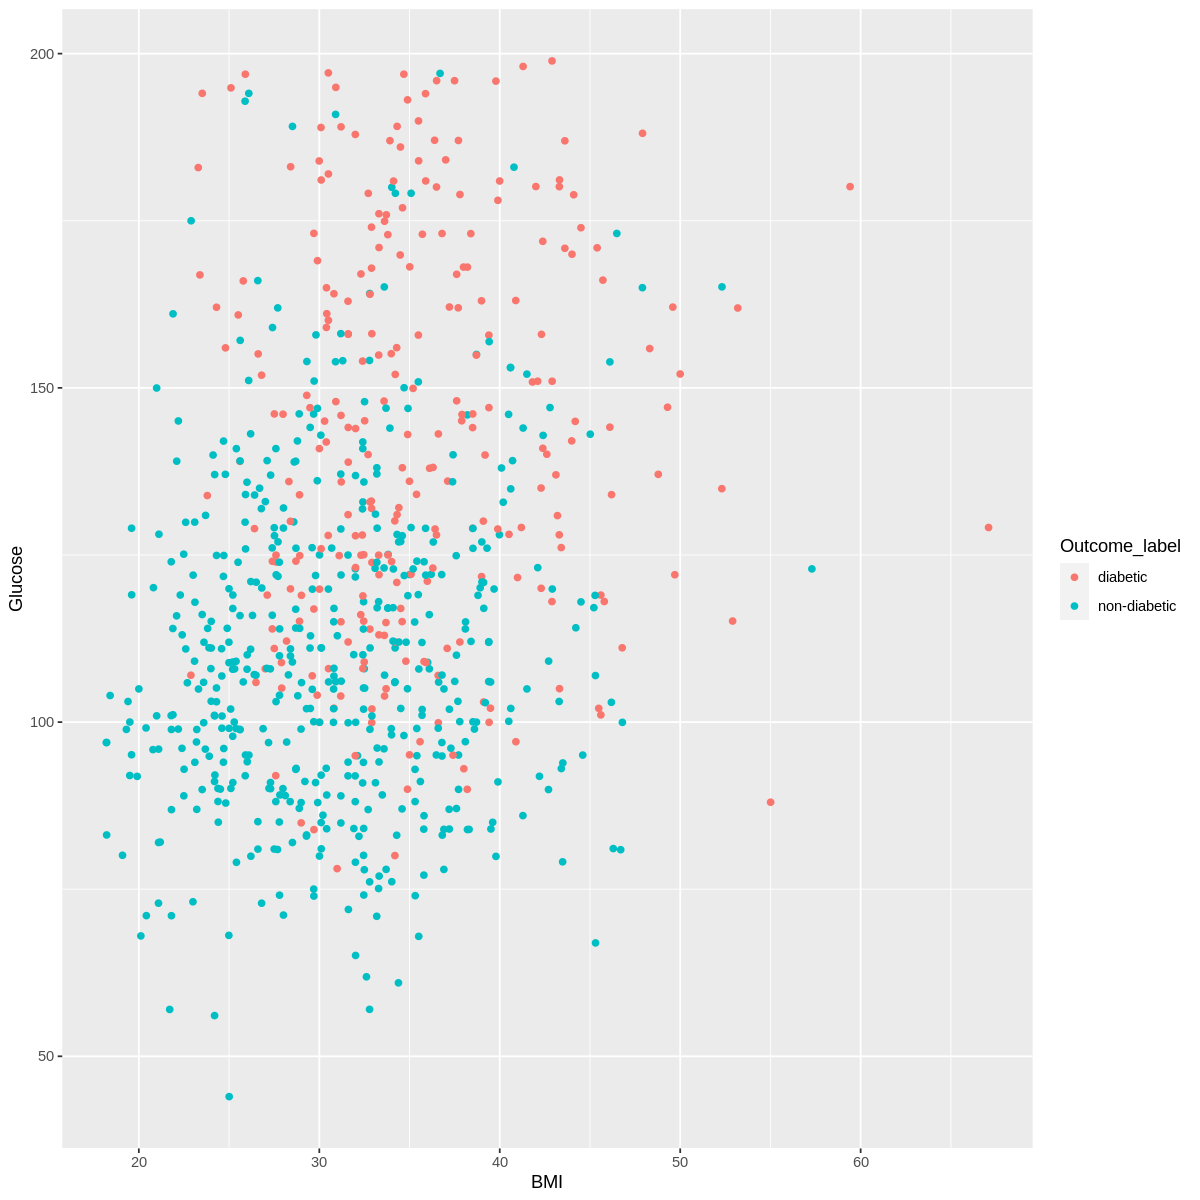
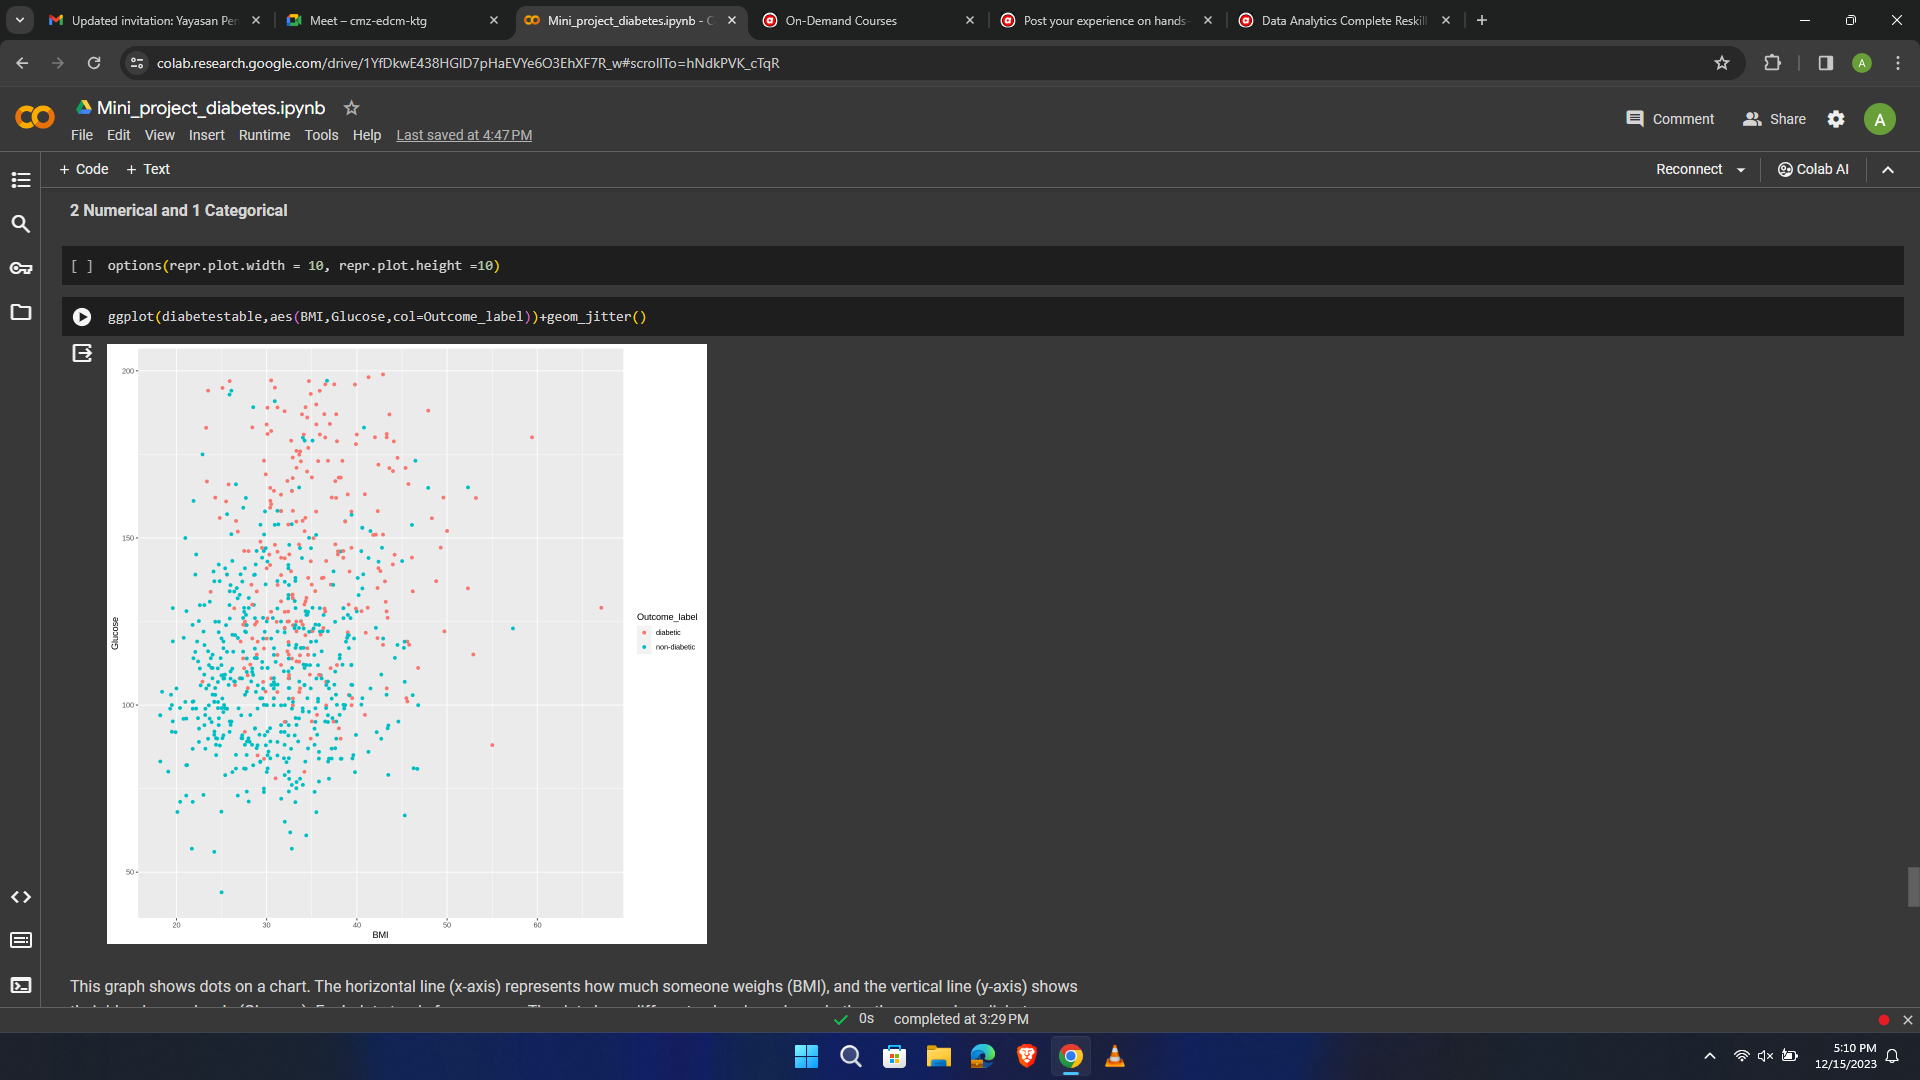
The mini project also helps me to quickly apply what i have learned and learn from my mistakes during the process of completing the project. Alongside with it i also experience how to present my findings and make some observation or conclusion of the dataset that was analysed. The data we handled is on diabetes among women and their diagnostic parameters that contribute to diabetes. We also manage to plot different type of graph according to different type of situation using R which is very versatile and could make graph with multiple of variable.

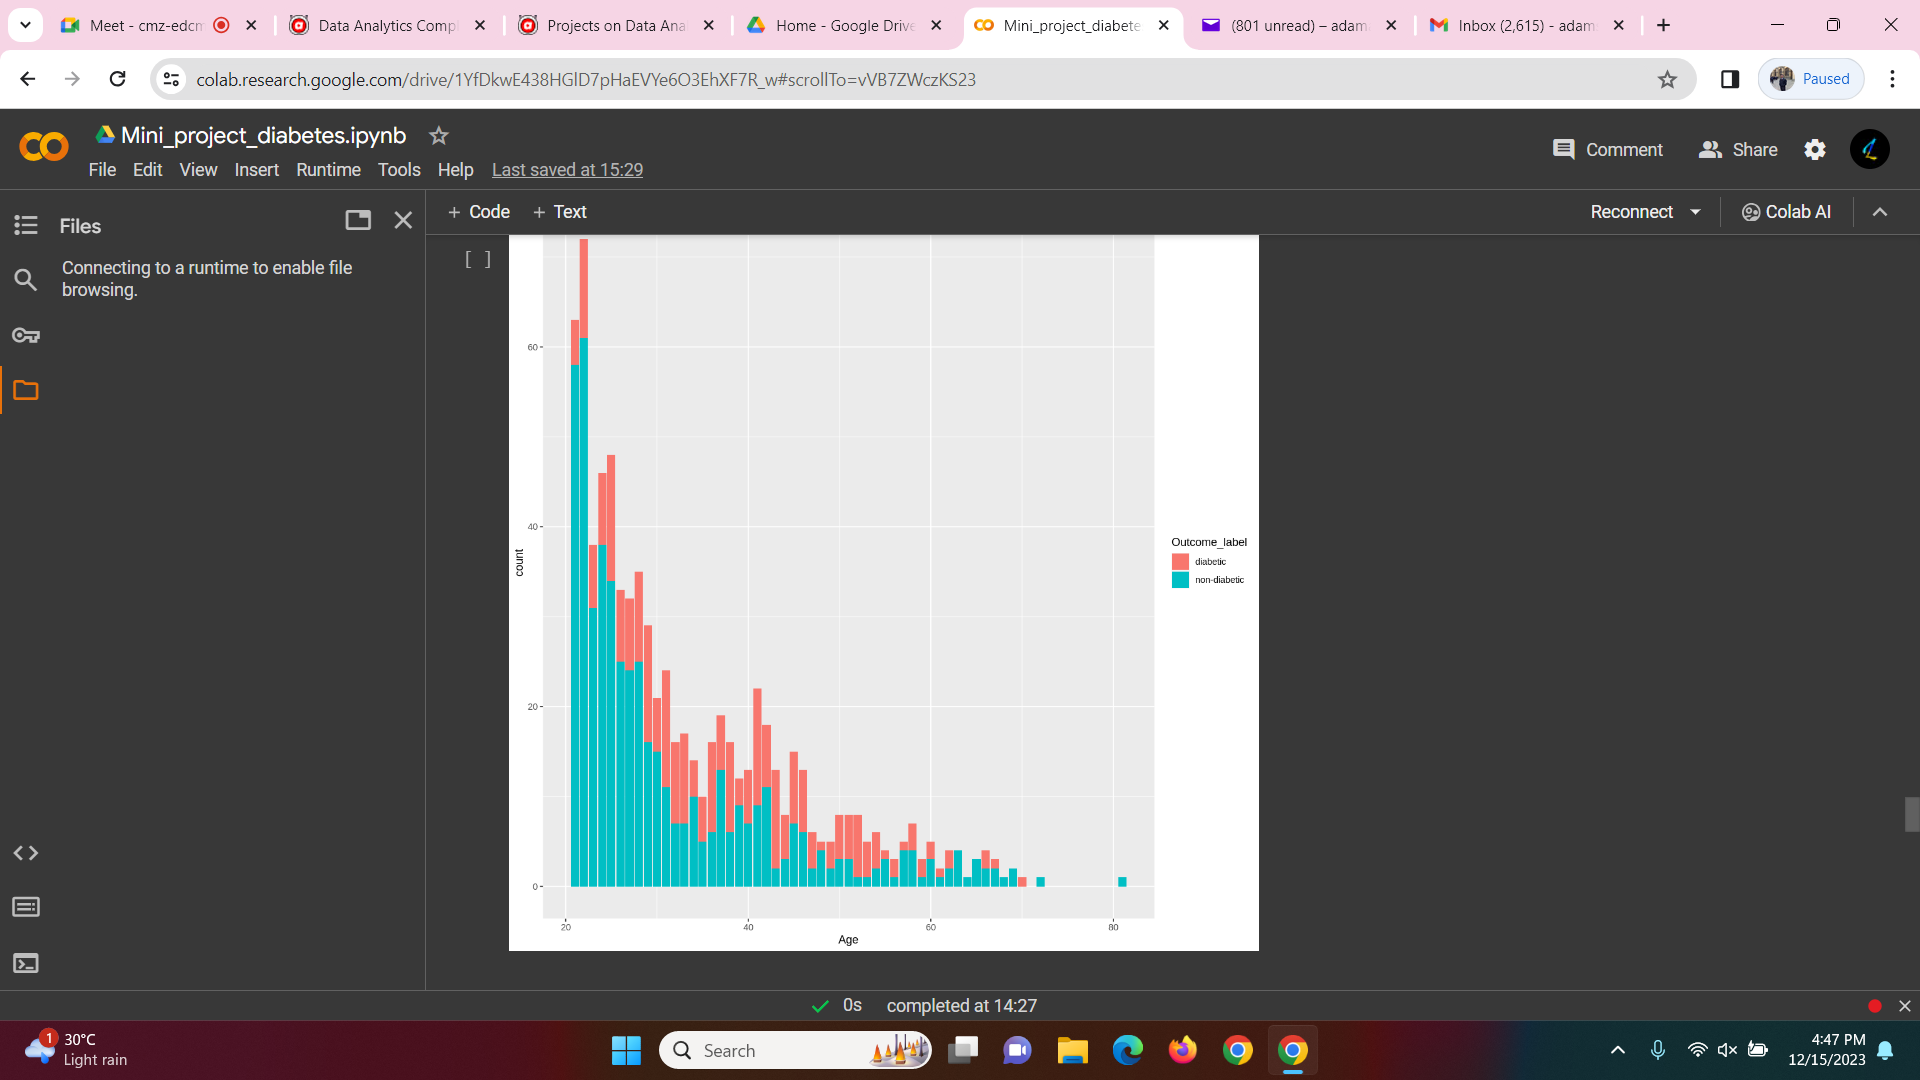
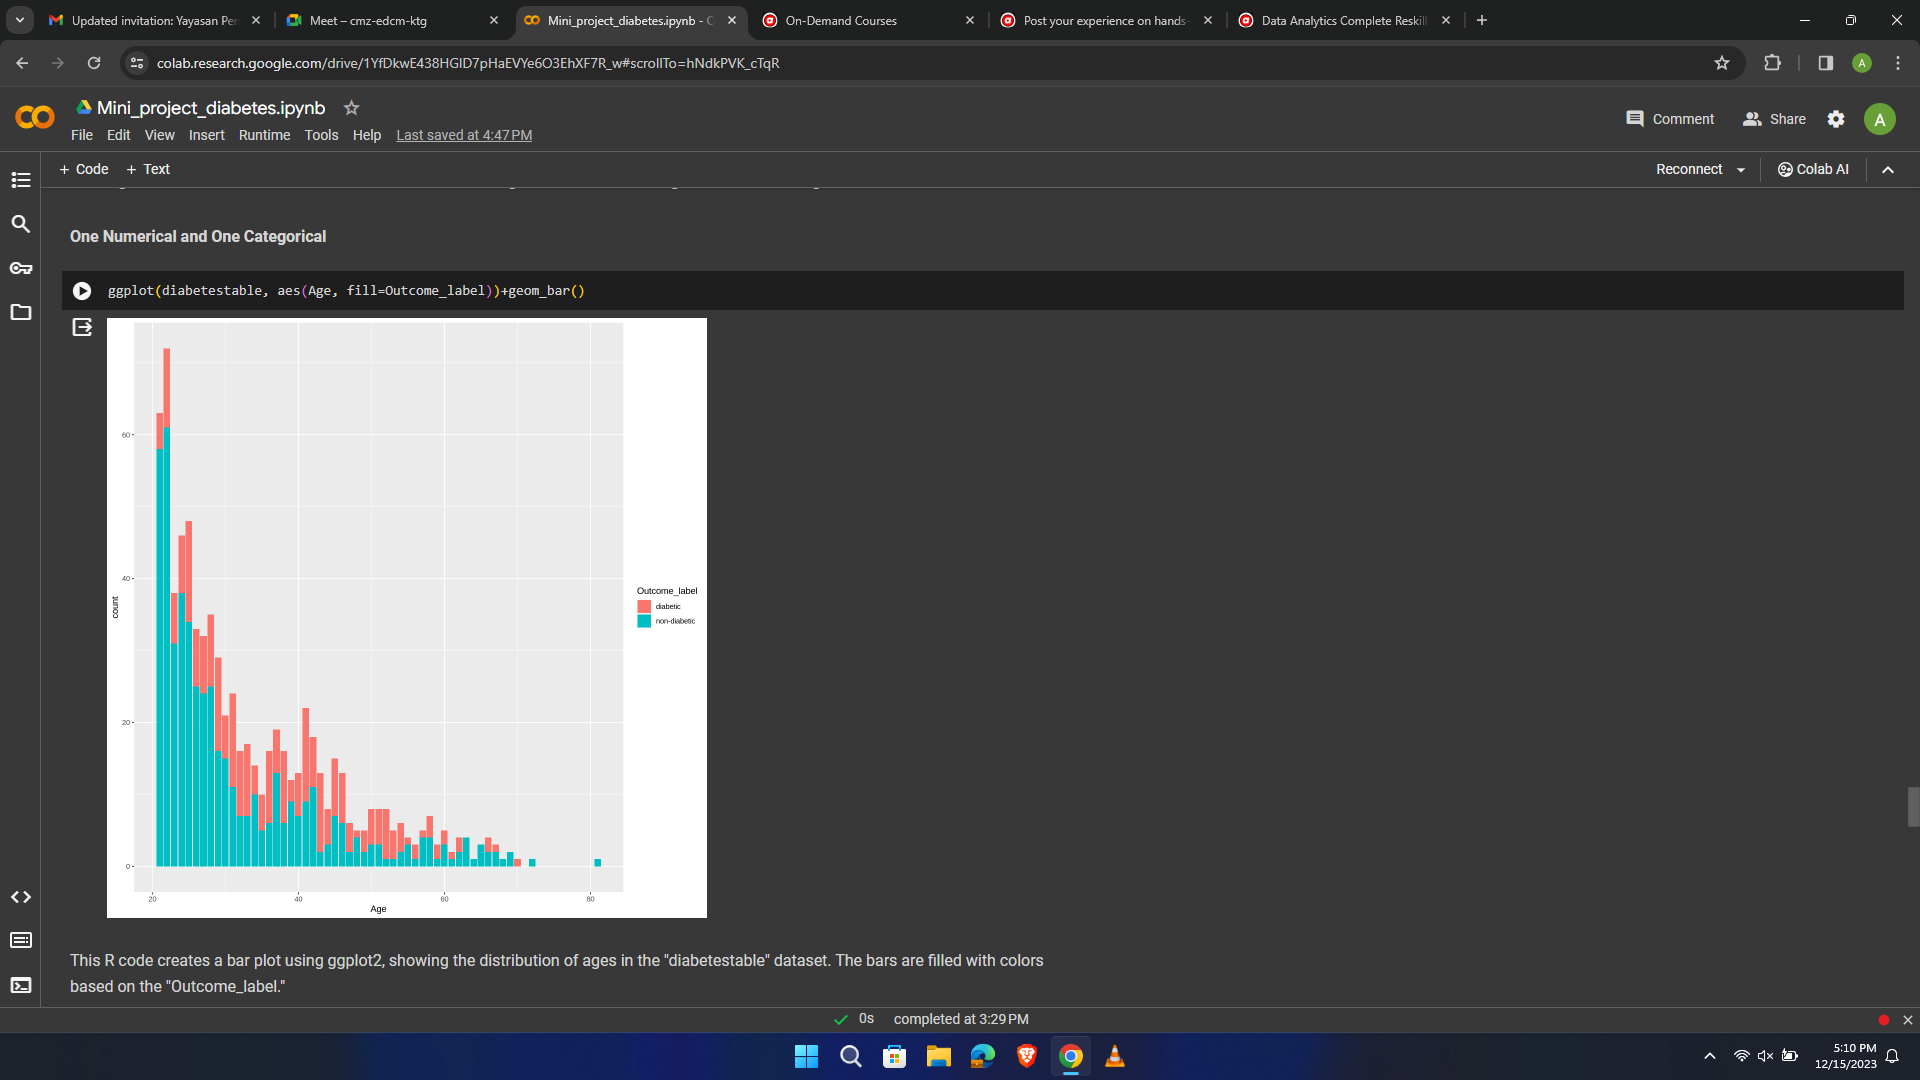
Below is some of the graph for data visualisation of our diabetes project. Some of them are on how BMI, glucose level, and age can affect the person on having diabetes.

Screenshot (71).png

Screenshot (72).png

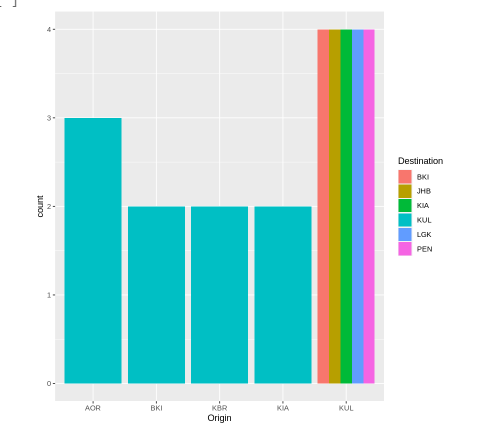
Problem Statement : To find the pattern of flight data based on the booking capacity
Our data consists of 6 column and 29 rows only. So actually we seems cannot find much regarding this data because its just a small data

ac86e484-d59e-4274-a942-24fa39c68eb5-image.png

I can conclude that the highest booking rate is to Langkawi while the lowest booking rate is to Johor Bharu. If there are more data regarding the flight dataset, such as time, there will be more correlation between the variables.

I am used to coding because of my background as a software engineer graduate. But it does not mean that I understood what does a data analyst do. I found that data analyst has a different perspective than what a developer have. The things like data type for a programmer is like a definite value and will not be change, as they need it to store the data. But for a data analyst, the data itself can be changed using factor so they can create a graph that can show the correlation of the data.

  • The key milestones that I encountered would be:
  1. Familiarizing myself with the tools and language that are needed to analyze data.
    -There are some new things that I learn & some to refresh.

  2. Understand the data and not just simply make a graph for the sake of presenting.
    -I need to find the target and achieve an objective while doing the charts.

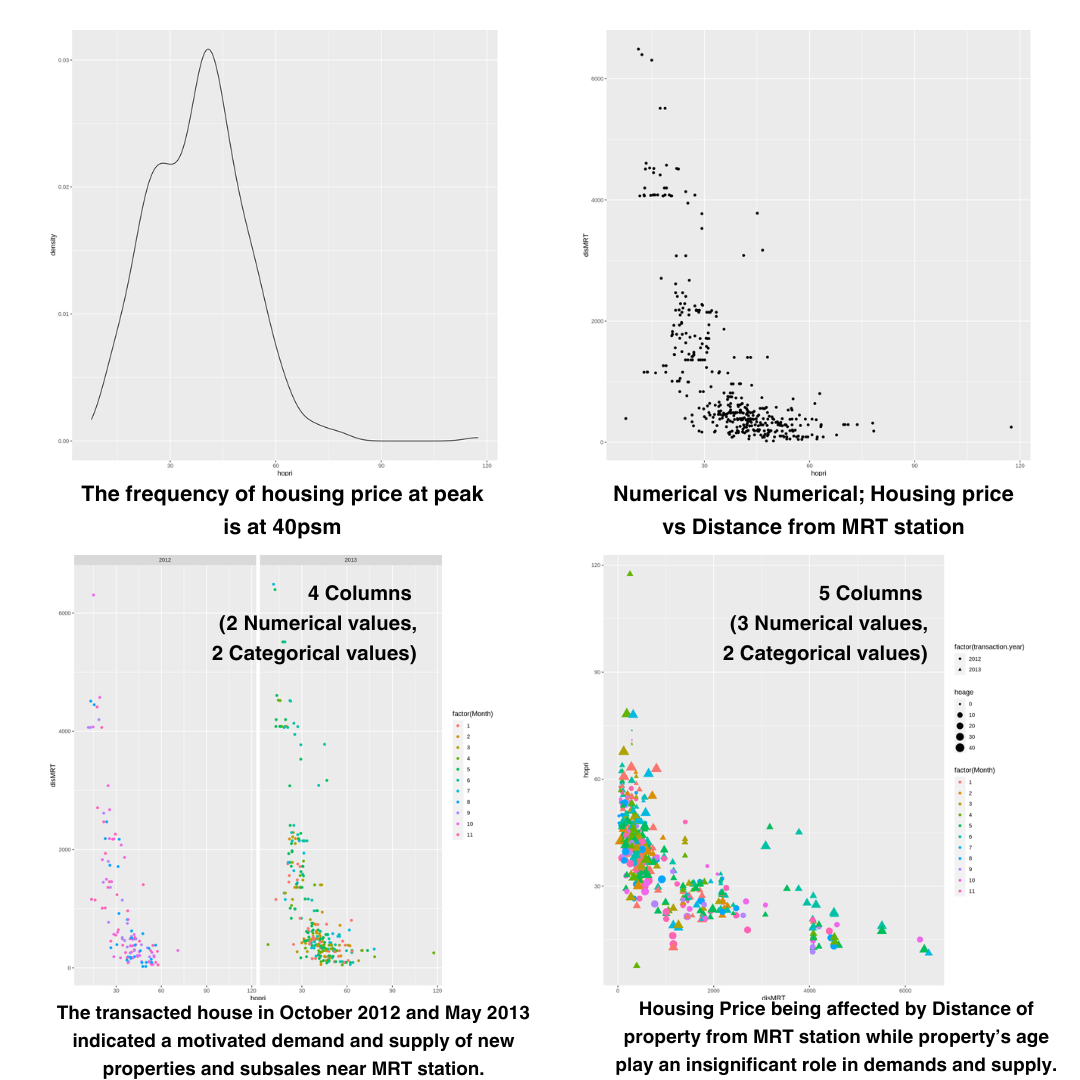
  • During this program my group chose to analyze a data on real estate. At first glance, the data seemed a bit overwhelming to me but after discussing, decompose the problems and research with my groupmate, I find that it is not that difficult as I thought it would be.

real_estate_g1.png
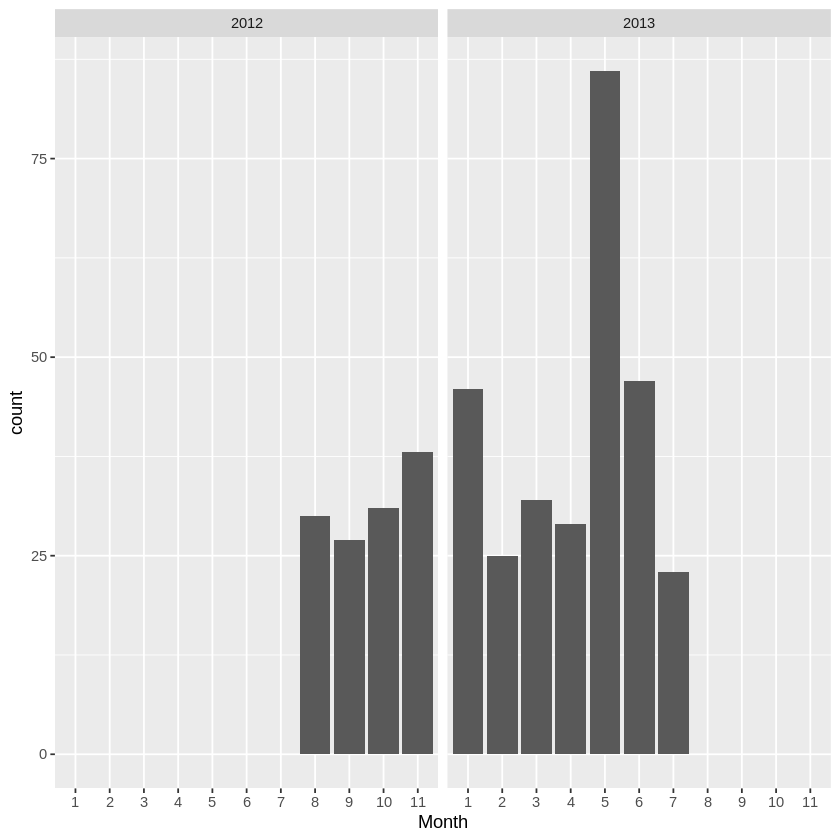
We conclude that we cannot determine the trend of economy growth because the data is only limited to one year.

real_estate_g3.png
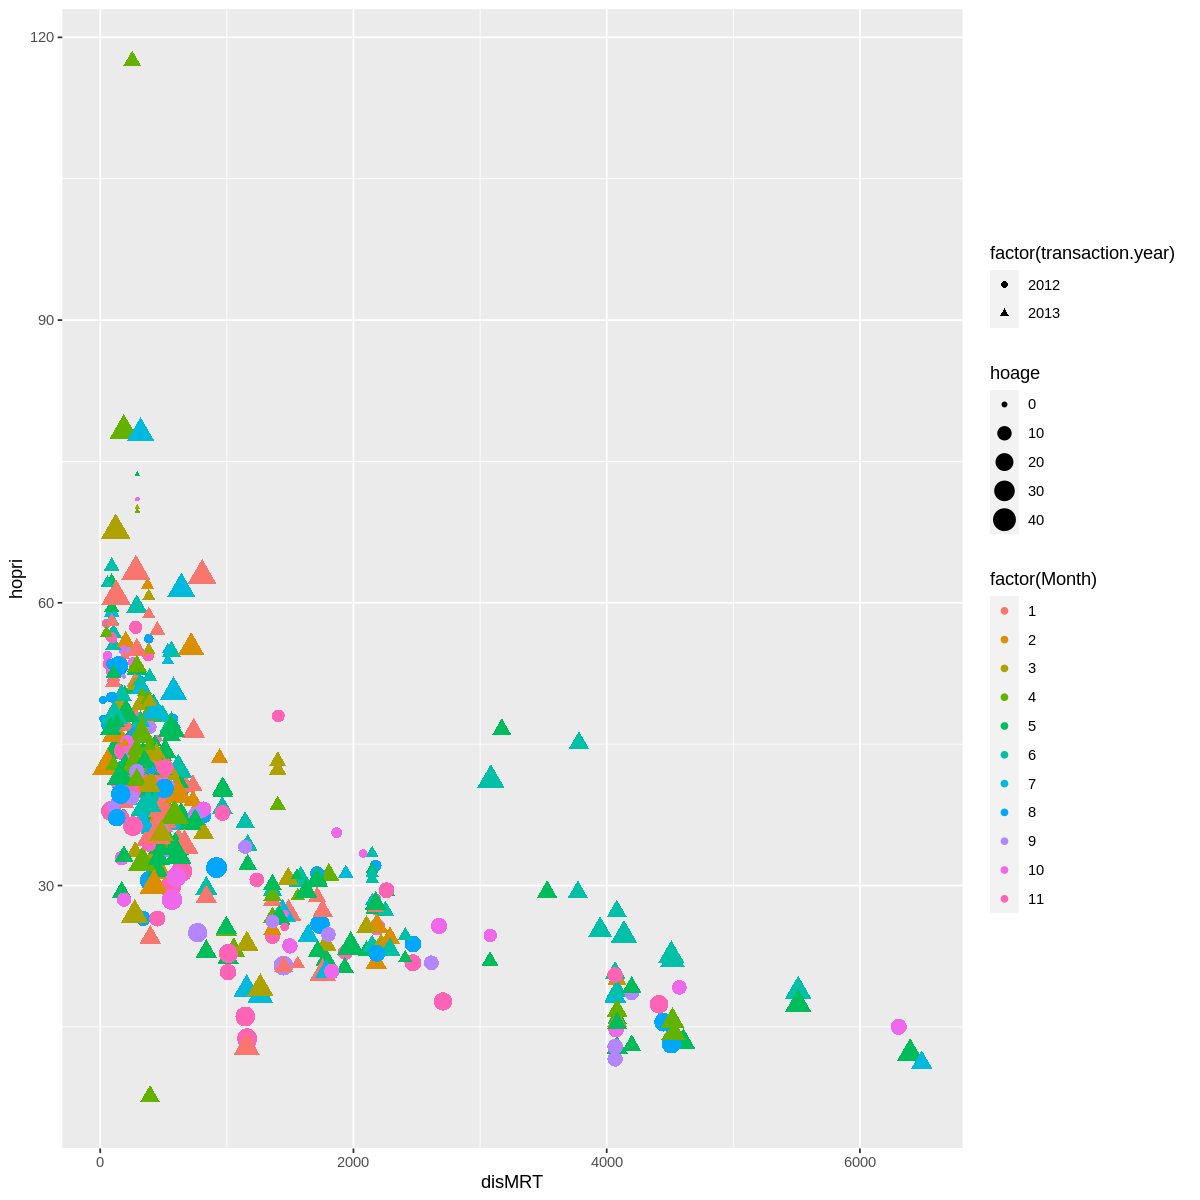
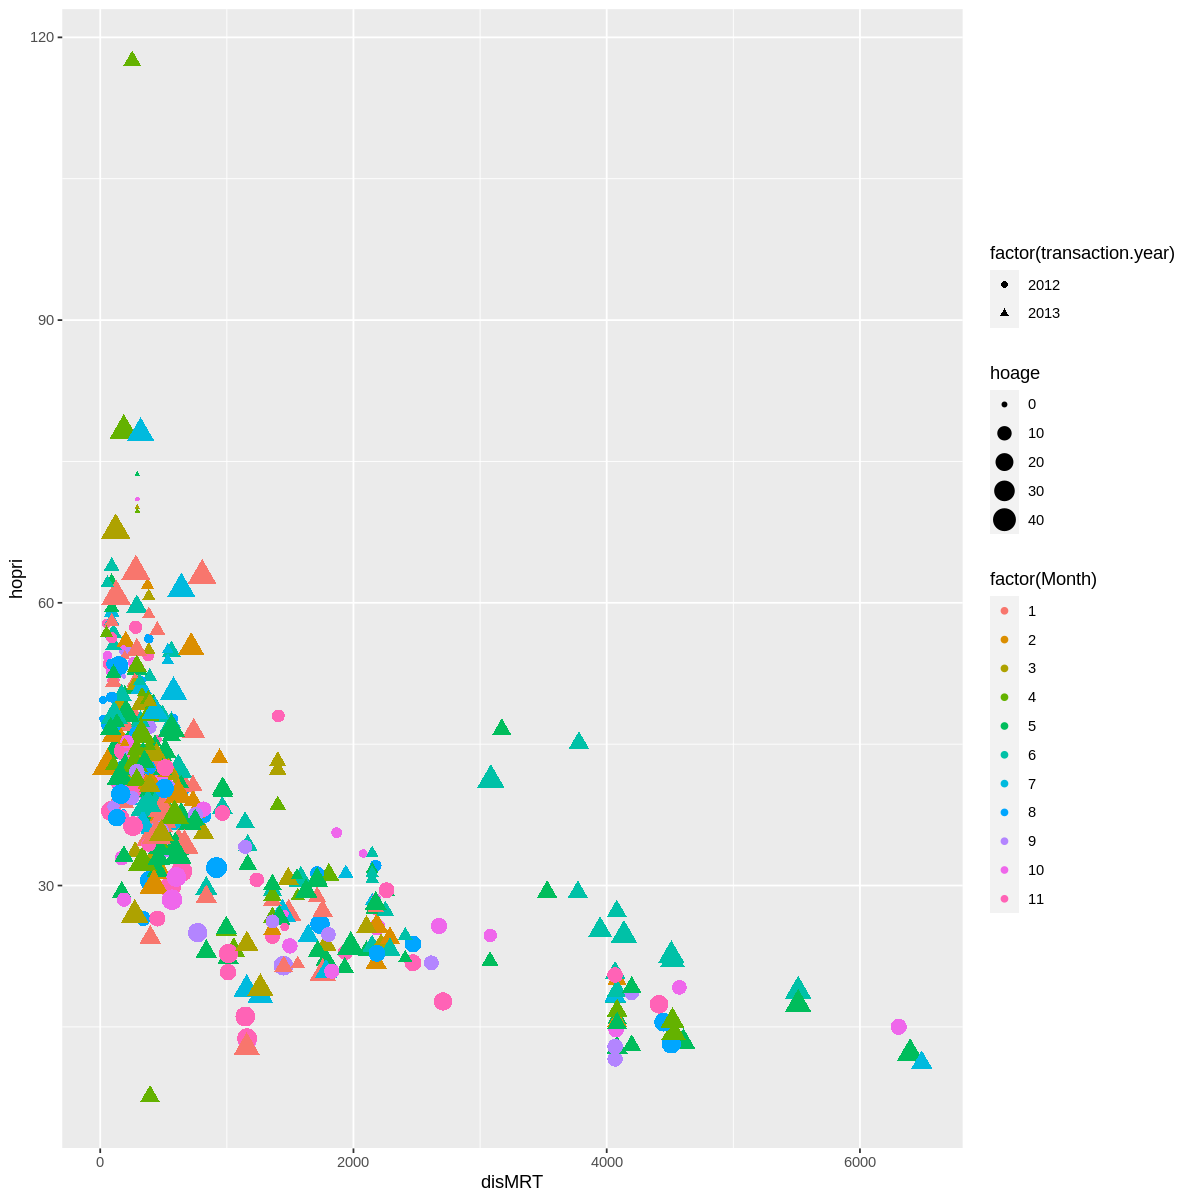
The higher the distance from MRT to reach the property, the lower the price of the property. At the same time, the age of the property does not determine the property price.

  • I have not yet use the R community to the fullest, but I can see that it may help me tremendously in my journey to upskill and reskill for my future career.

  • For tips, I would say that it is normal to not know things. Everyday is a journey to learn something new even if it is not something related to our line of work. We need to accept the new things we learnt with an open mind and decide how we can we use it to improve ourselves.

Lastly, thank you Dr Sara for tutoring us these 4 days & thank you Yayasan Peneraju for sponsoring us. I am really glad to be here.

As my past experiences include Digital Marketer, Property Valuer, and Property Operation Executive have deeply transformed me into a somewhat logical analyzer, I found R language to be another level of analysis I have yet to master. It is, without doubt, one of the best tools to extract, explore, and visualize data most efficiently and attractively and serve many department areas including Real Estate.

Data analysis for project Real Estate Housing Price Prediction-2.png

Me and my team, we decided to take on the Real Estate Data set. We conducted a series of serious discussions on our understanding of the business before we started with Data Preprocessing, Data Exploration, and Data Visualization with Google Collab. Determining the Dependent column and the Independent column from the get-go also allows us to ensure the path as a Data Analyst is on the right track!

Coding with Google Collab for R is easier to handle. I reached a basic understanding and application of the R language in just 4 days.

I love the way Dr Sara ensures everybody is not left behind. She always ensures the beginners like me can follow the class, while those with intermediate and advanced knowledge know what and how to apply advanced formulas. The one thing she would always advise us in the class, BE BOLD WITH YOUR ANALYSIS! Be Bold is what I tried to do the entire time. And my classmates are all very supportive and cooperative.

Communication is key. Listening is the way. Also intense focus. Without good cooperation with each other in the class, nobody among us could finish what we started and have a good understanding of R.

As always,
Emma Shahrir.

My journey into data analytics and R programming begins when I apply for an upskill program at AirAsia academy and finally gets the opportunity to join the classes. I would say that this journey here is valuable for me because Dr. Sara has the gift of explaining the theoretical and practicality of data analytics and R programming very well. I like her intonation when she is teaching in the class where her tone is tone monotone and she knows how to make us as a student of a complete beginner to pay attention. Moreover, her storytelling style helps us as a student to grasp the info very well.

Specific moments that stand out are when I was assigned in a team, and we have to complete a mini R project. The project is due in less than 24 hours after we have learnt the theory and practical terms of R programming using Google Collaborators. We as a team chose the Olympic dataset to work on our mini R project.

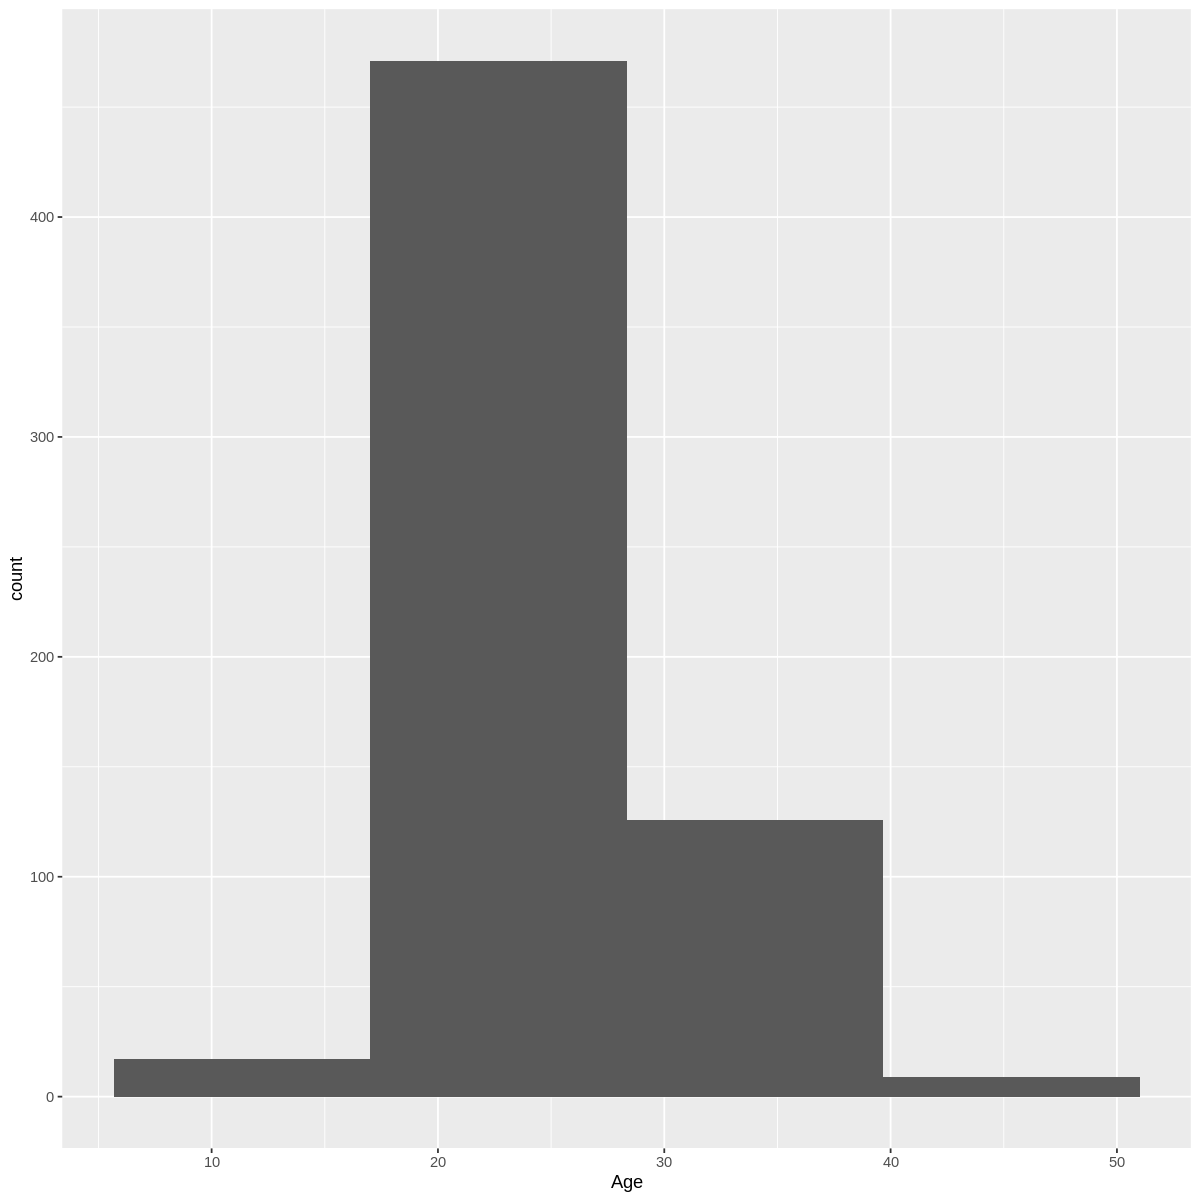
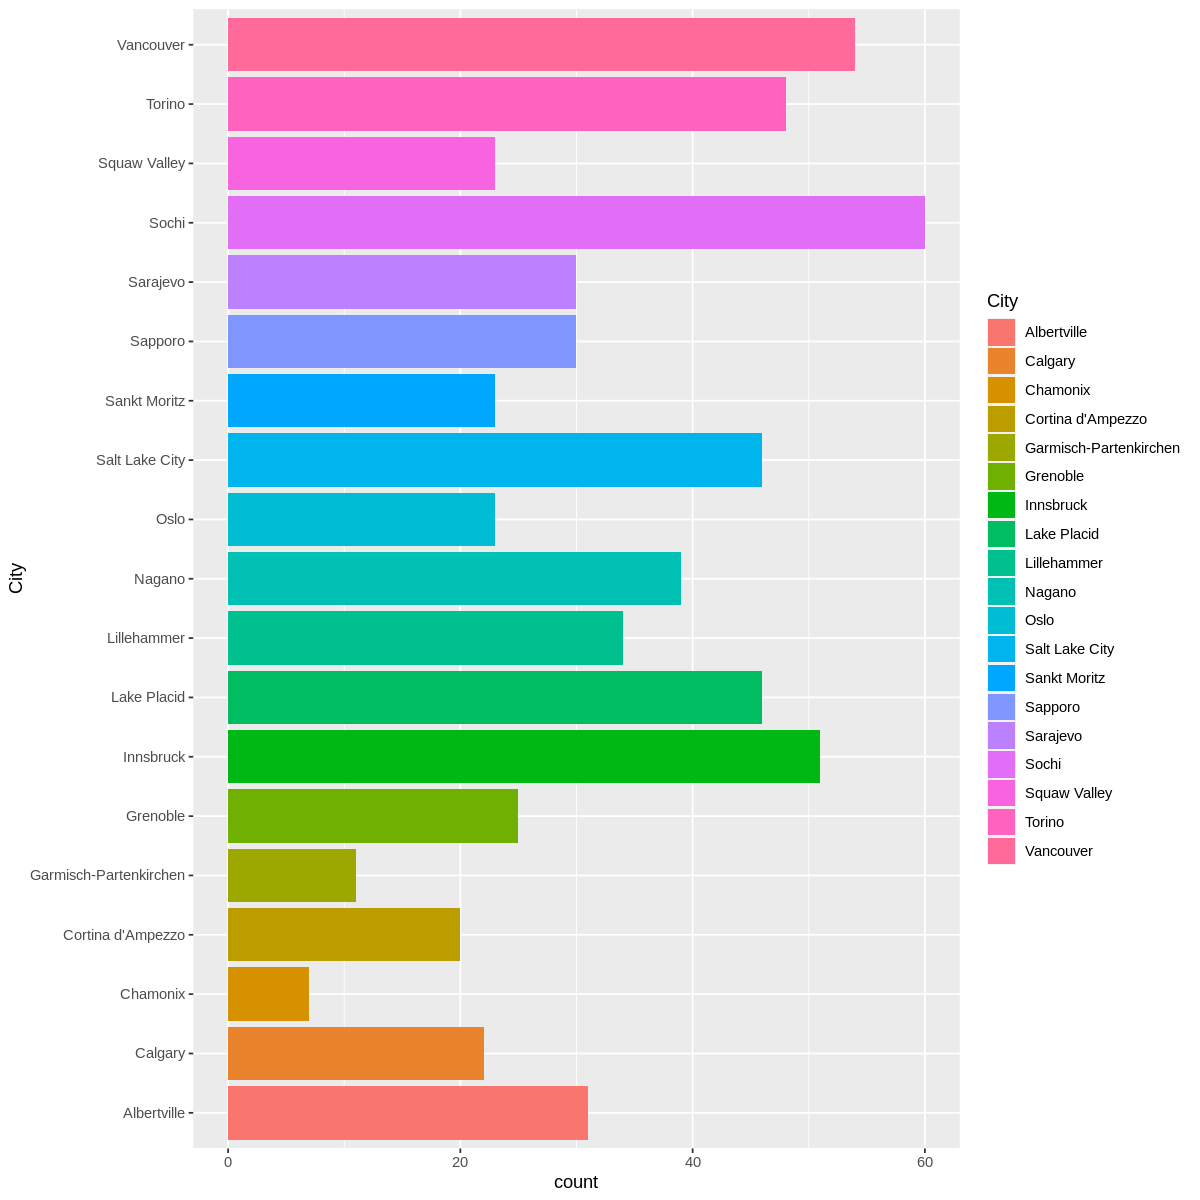
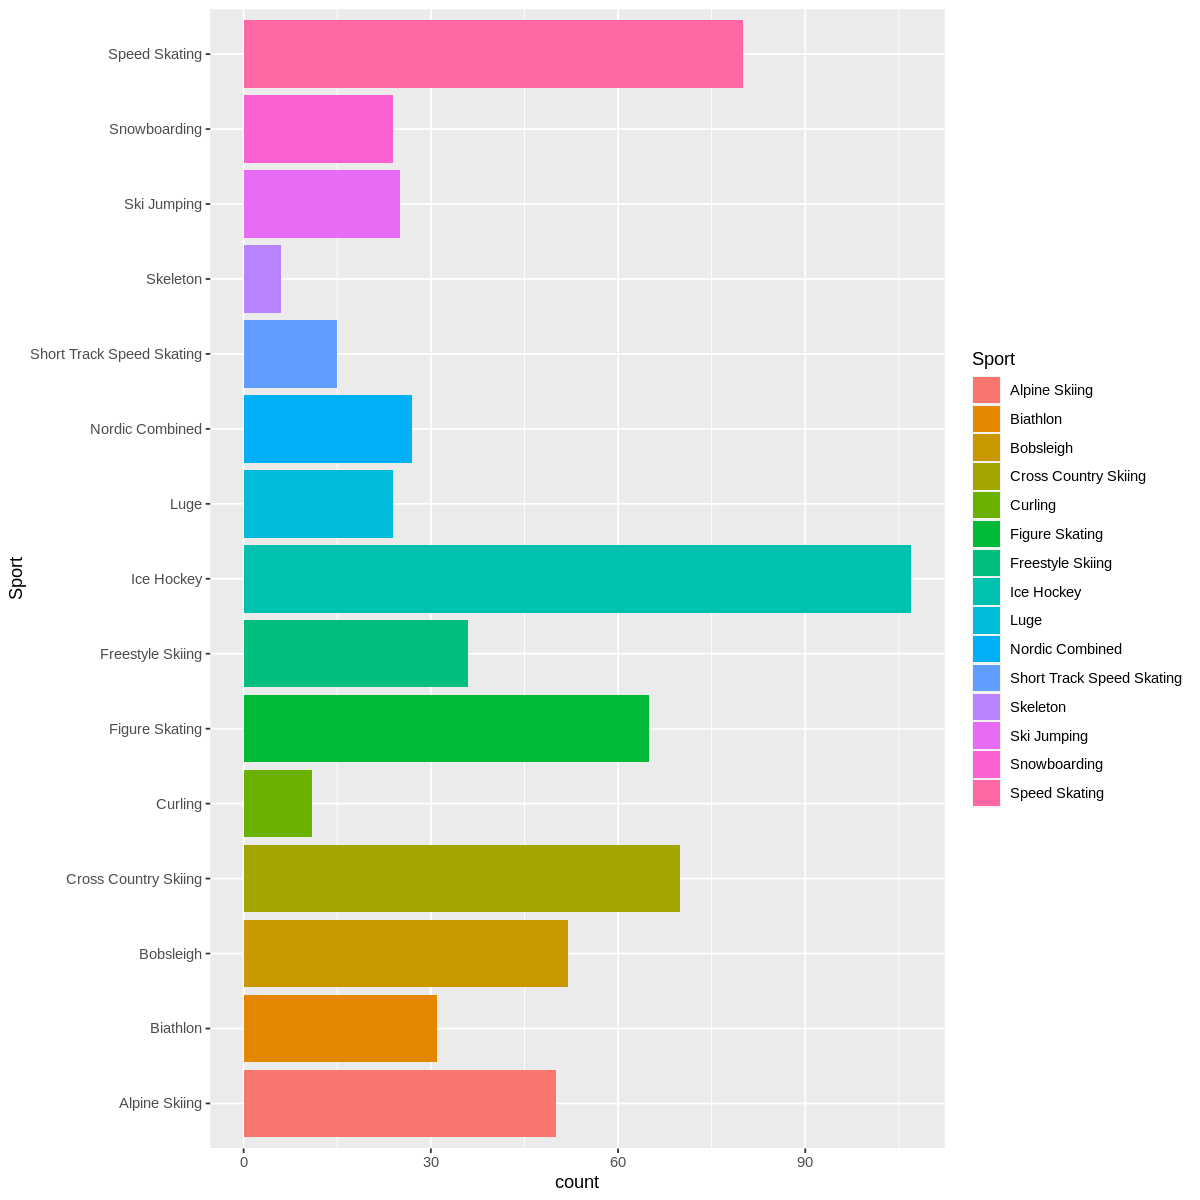
We changed our problem statement a few times because we werenโ€™t sure which columns, we can use to relate the data to the graph that will be plotted later on using ggplot. However, itโ€™s fascinating we get to delved into the world of Winter Olympics. We as a team specifically decided to focus on the participation of male and female athletes from the United States during the winter seasons.

There were missing values in the 70000 columns Age, Height, and Weight, therefore we decided to replace the missing values by average.

Next, we convert the categorical column into factor to check if there are any missing values in the Sex, Season, Sport, City, and NOC.

Initially, the olympic dataset has around 70000 columns data but we narrow down the data to USA during winter only and print the new data which is usa_winter_data by using this command below in R:

usa_winter_data <- subset(olympictable,NOC=="USA" & Season=="Winter")

To remove the unwanted table, we use the command library(dplyr) and create a new OLympic table with which data we want to focus on which is Sex, Age, NOC, Year, Season, City and Sport.

Further data cleaning was done by finding the duplicated values in a new Olympic table and removing the duplicate values. The new data is checked again to see there are no duplicates.

Data Visualization is the last goal to achieve in this mini R project, I would say this part is the most challenging because there are variables that we need to plot and find hypothesis. In most cases, when plotting a graph using R, the numerical value is typically placed on the y-axis, representing the dependent variable, while the categorical value is placed on the x-axis, representing the independent variable. However, itโ€™s important to note that there are situations where the axes can be switched depending on the specific analysis or visualization we want to achieve. The choice of the variable depends on which axis is the challenging part as it depends on the nature and the goal of our graph.

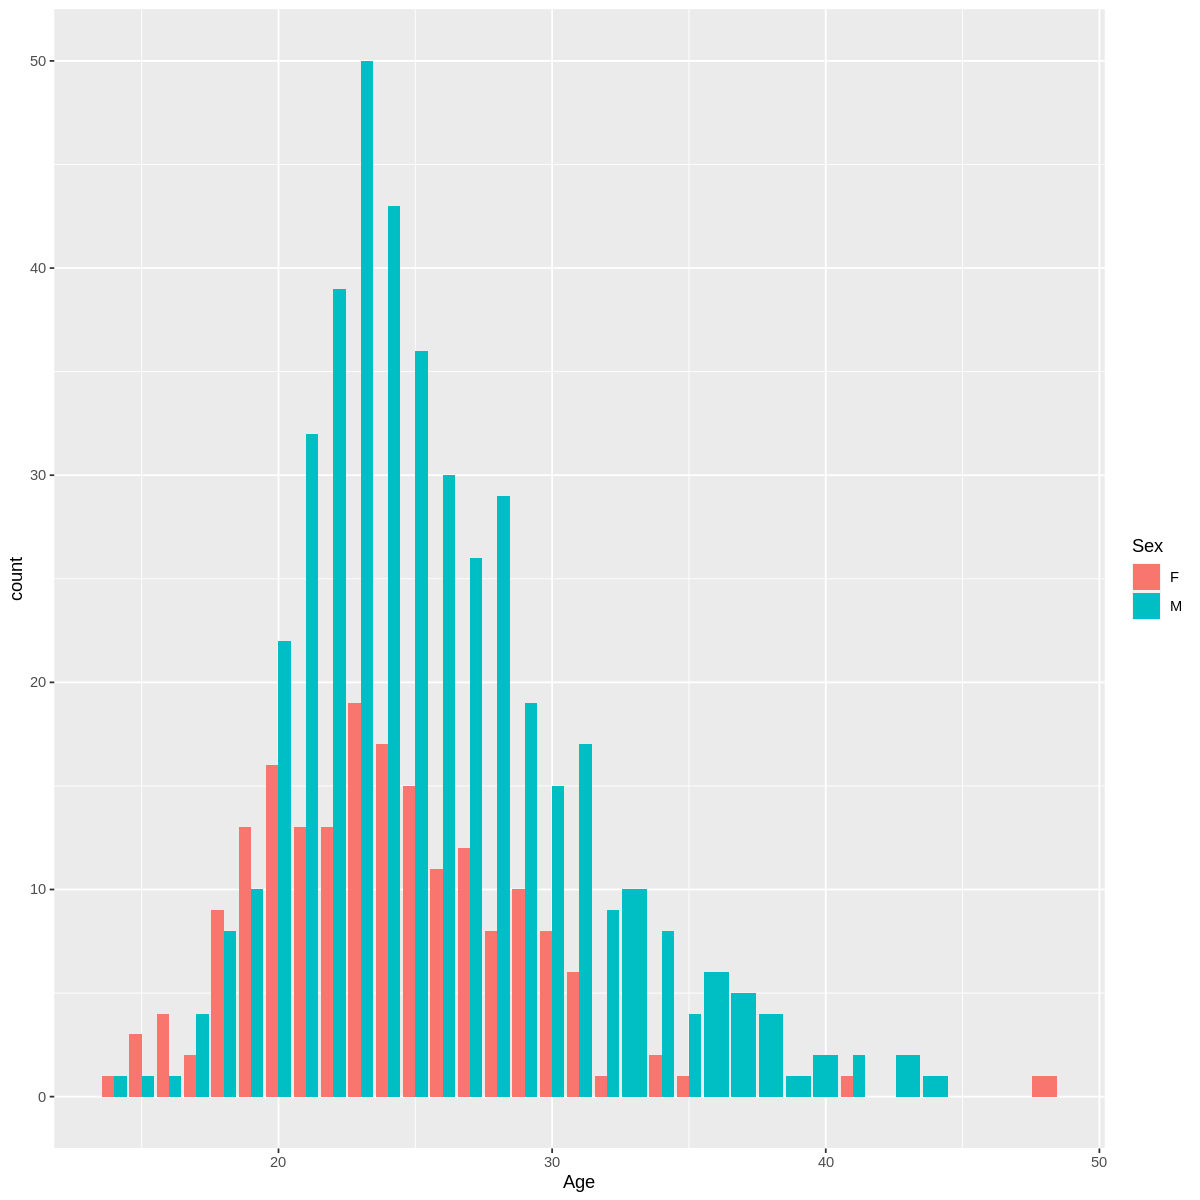
one variable.png

two variable.png

one variable flip 2.png

two variable betul.png

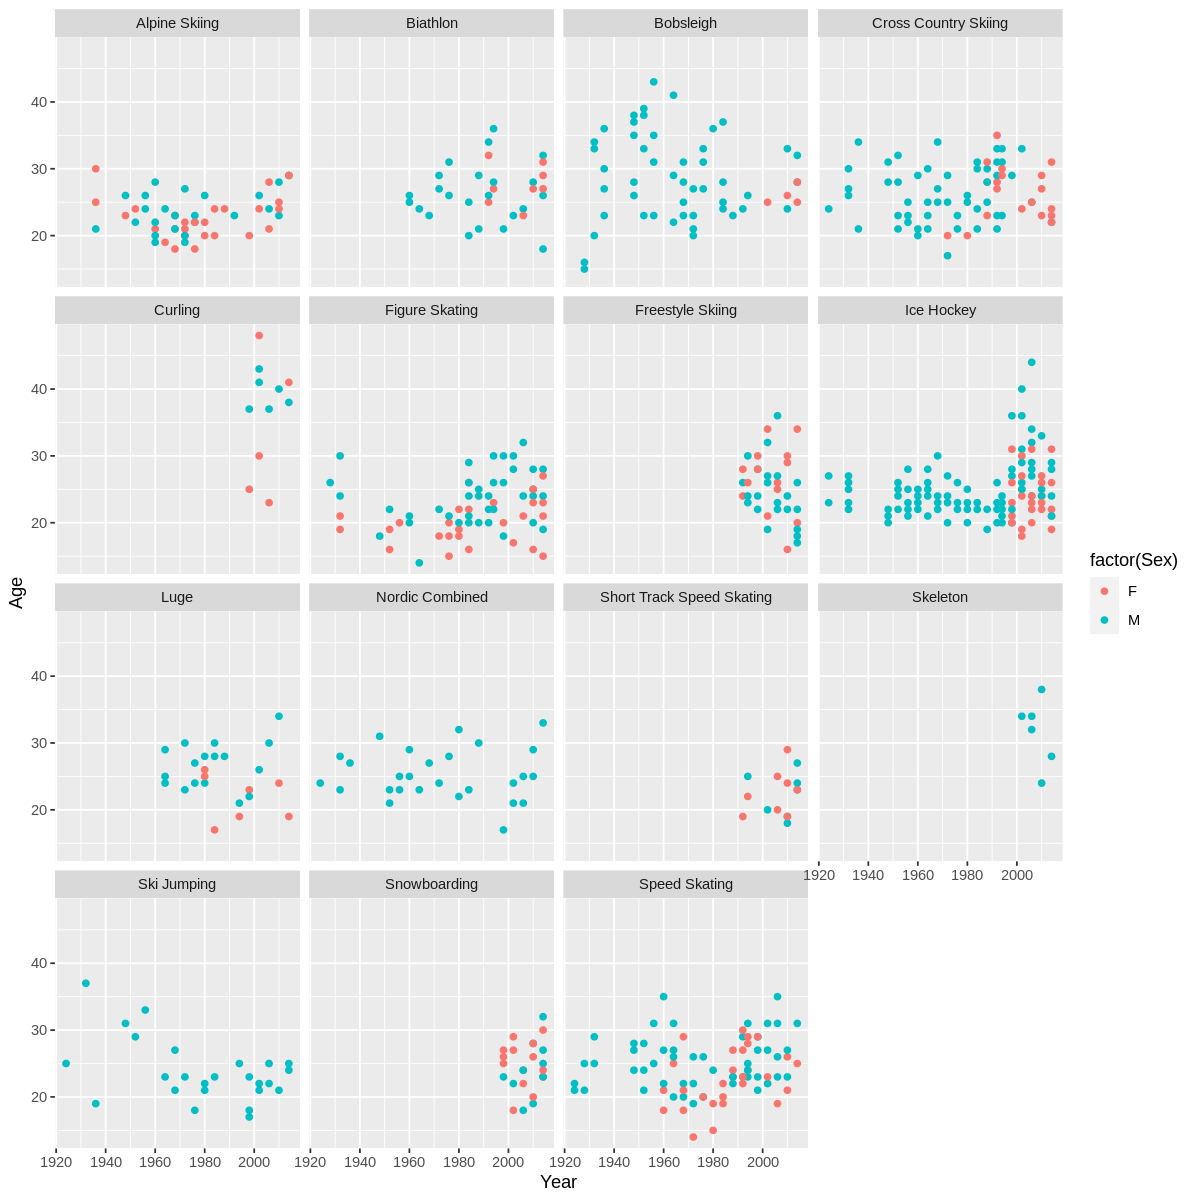
Four Variable (Two Numerical & Two Categorical)

four variables.png

  1. During the Winter Olympics, there is a higher representation of male athletes compared to female athletes from USA.

  2. There are three sports where male athletes have a significant presence

i.e Ski jumping,Skeleton,Nordic Combined

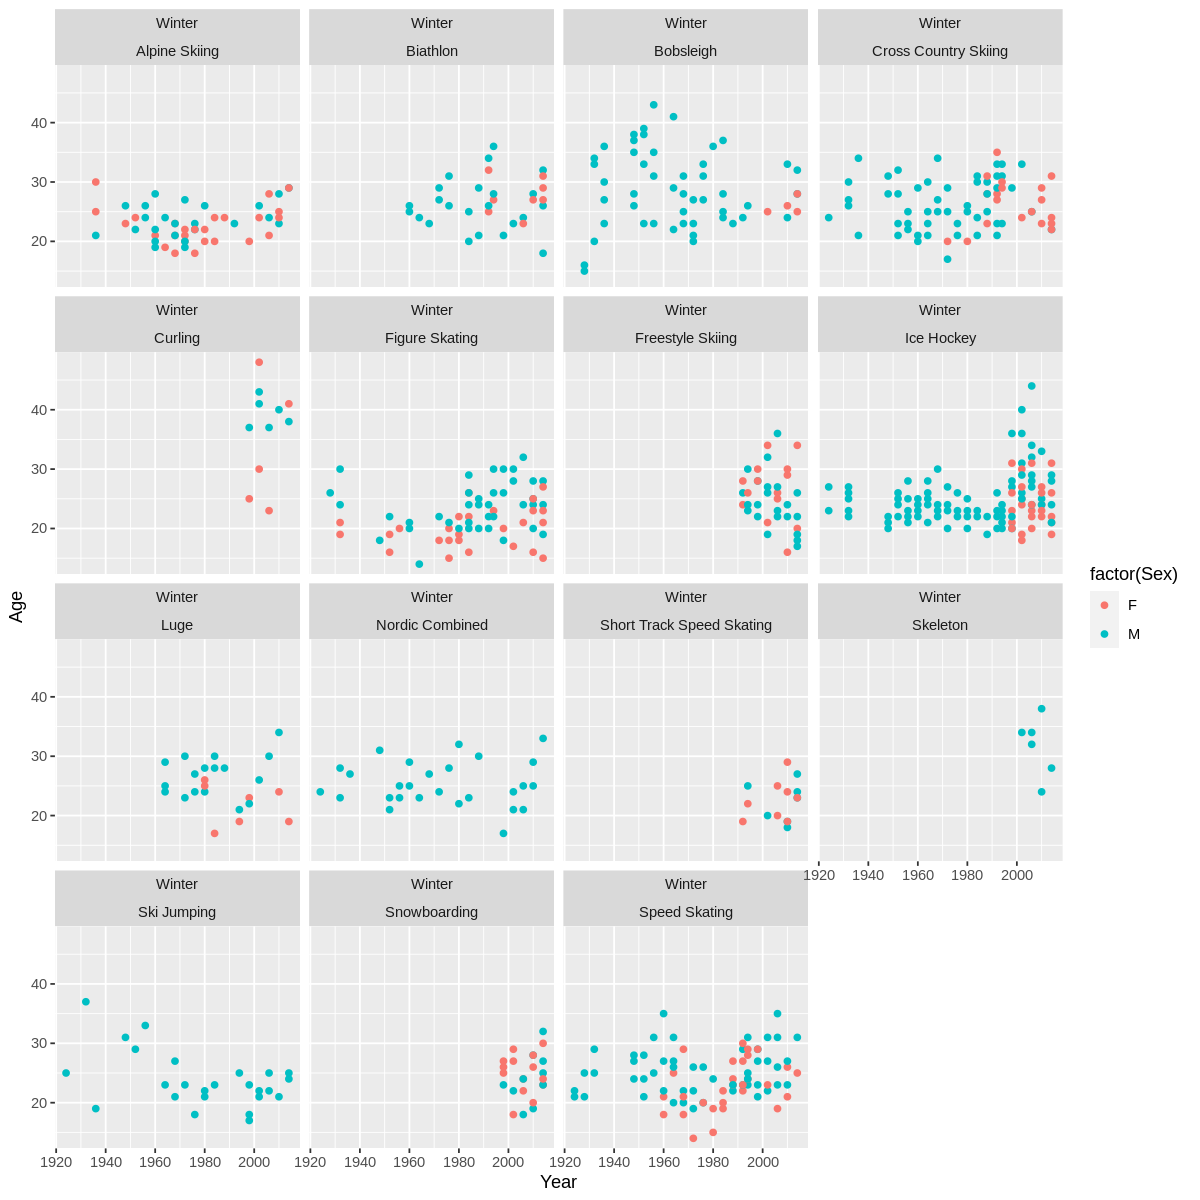
Five Variables
five variables.png

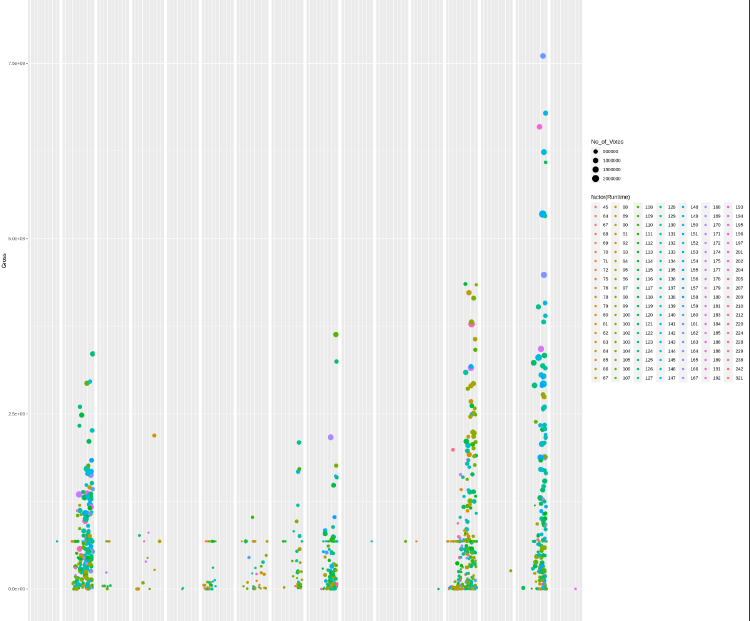
1b4738cf-9a3e-48cf-810d-e1393254fd42-image.png

We have gained knowladge of data mining and explotary data analysis by using R programming.By using this skill we have succesfully answering our question about the factor that affecting gross.We get know the Certificate ,movies duration the real factor

How did your journey into data analytics and R programming begin?
To be honest i have zero idea how it works at first..but now i got the the rough face how it works,but it still gonna need more for me to get more familiar with it.
It quite hard I know it gonna takes more time for me but i will try not to giveUP..
Let's walk together.

I would like to say thank you to Dr.Sara for being so patience guiding us and for making this course so much fun.

In addition, i would like to say how lucky i'm to be here.

As for our final mini project, to be honest it was not easy for me but i was so grateful to my team mates since they are so helpful, even though i might have drag the team a bit since my pace a bit slow in this area.

Anyway the end is just a new beginning.

graph.png

@saranyaravikumar

Sorry Dr Sara, we have mistakenly 'replied as a topic' to your post for our visualisation data presentation yesterday. We will reply here again with the results of our Colab.

First of all, our group members consists of:

  1. Nur Fera Ereen
  2. As Noor Aqilah
  3. Nur Hidayah
  4. Nazatul Shahirah

We have selected the HR_Data.

Problem Statement: To identify the duration of last employed job impacts on employee's decision on changing the job.

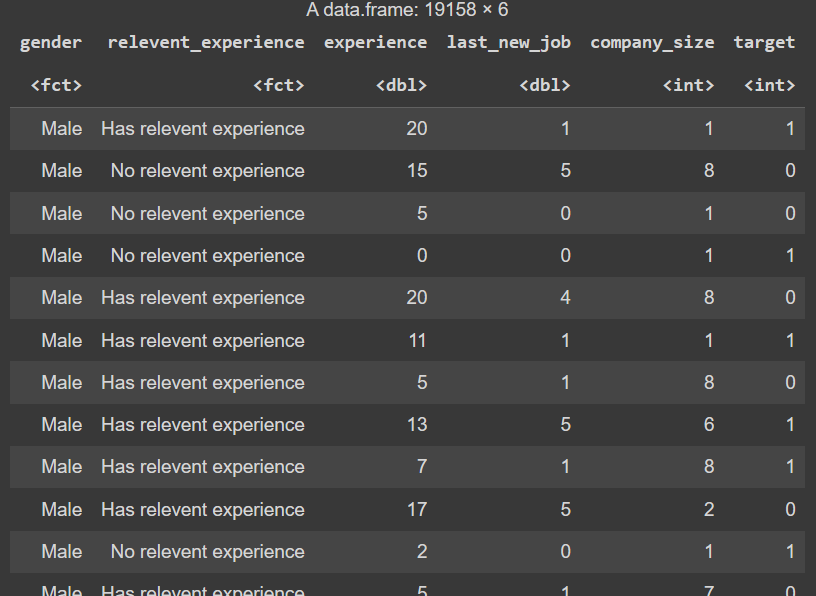
f6582a7e-308b-43a4-a56d-c29d6b6cacd5-image.png

Our dataframe have six variables:

  • gender: Categorical variable representing the gender of the individuals (e.g., "Male," "Female," "Other").

  • relevent_experience: Categorical variable indicating whether the individual has relevant experience (e.g., "Has relevent experience," "No relevent experience").

  • experience: Numeric variable representing the years of experience.

  • last_new_job: Numeric variable indicating the time since the last job change.

  • company_size: Numeric variable representing the size of the company.

  • target: Binary variable (0 or 1) indicating whether the individual is the target of interest.

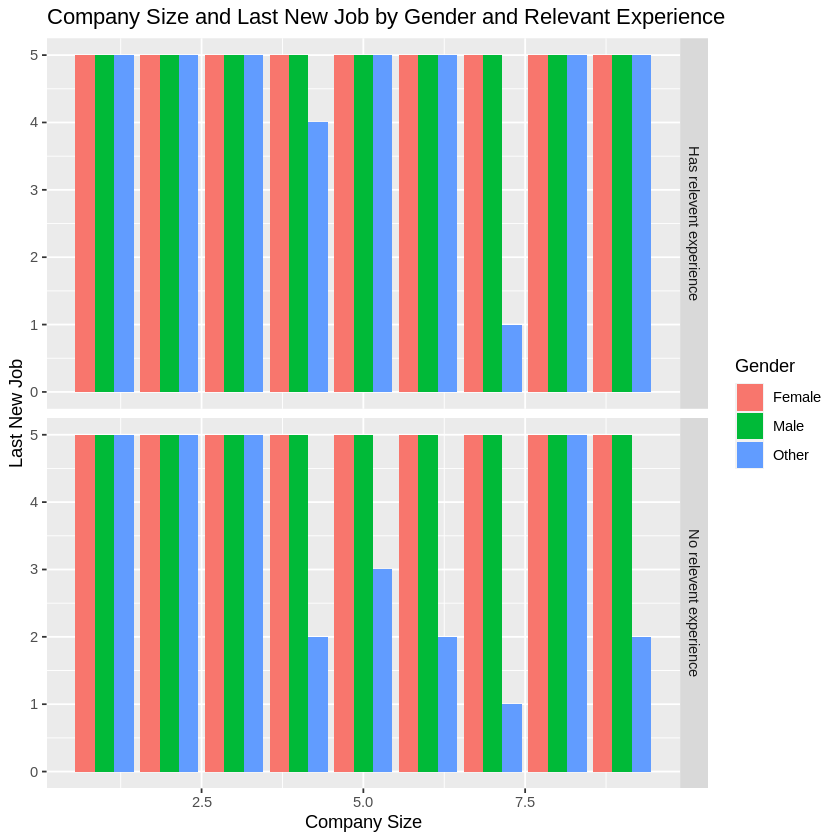
Four Variable (Two Numerical, Two Categorical)
4 variables.png
Interpretation: This grouped bar plot visualizes the interaction between company size, last new job, gender, and relevant experience.

Conclusion: The plot suggests that the distribution of last new job changes varies across different company sizes, and this relationship differs between genders and relevant experience groups.

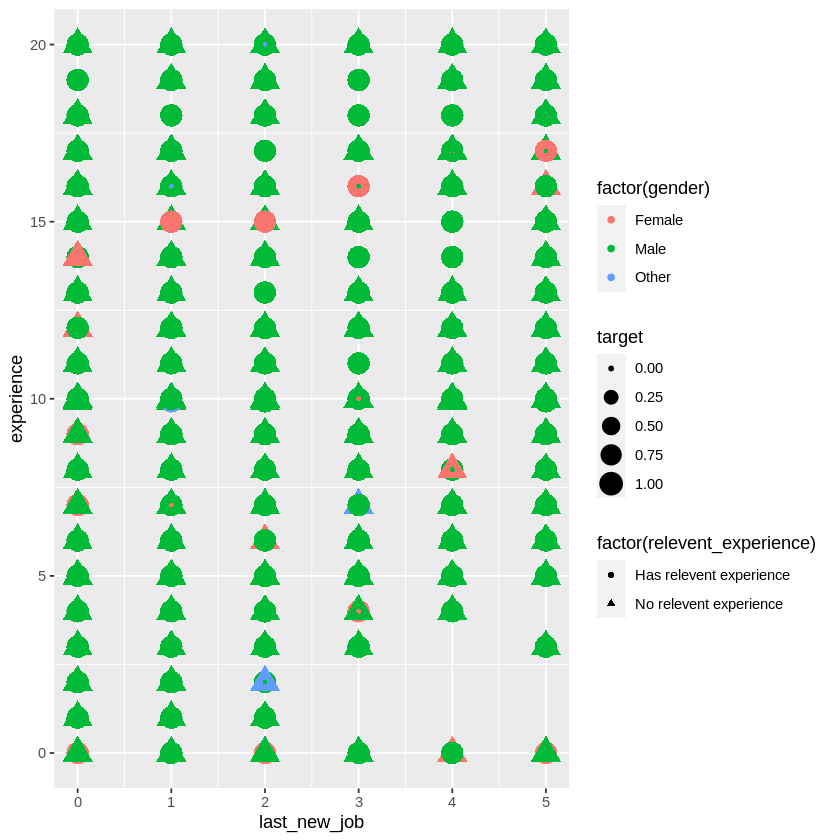
Five Variable (Three Numerical,Two Categorical)
5 variables.png

Interpretation: This scatter plot shows the relationships between experience, last new job, and target, with points colored and shaped according to gender and relevant experience.

Conclusion: The plot provides a multidimensional view of the dataset, allowing for the examination of multiple variables simultaneously.

Findings:
We have identified that the duration of last employed job does give impacts on employee's decision on changing the job. As their duration of last employed job and experience increases over the years, they have the more tendency to stay at their jobs.

Thank you for your teaching, we truly appreciate your efforts and patience to guide us through! You make us become super interested in R-coding ๐Ÿ™‚ โค

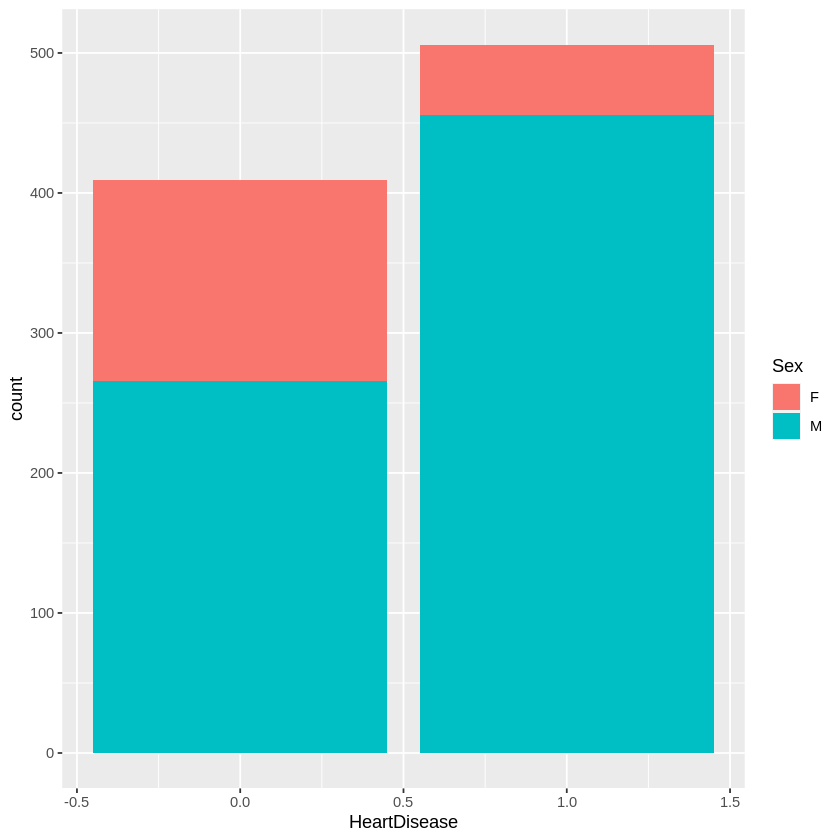
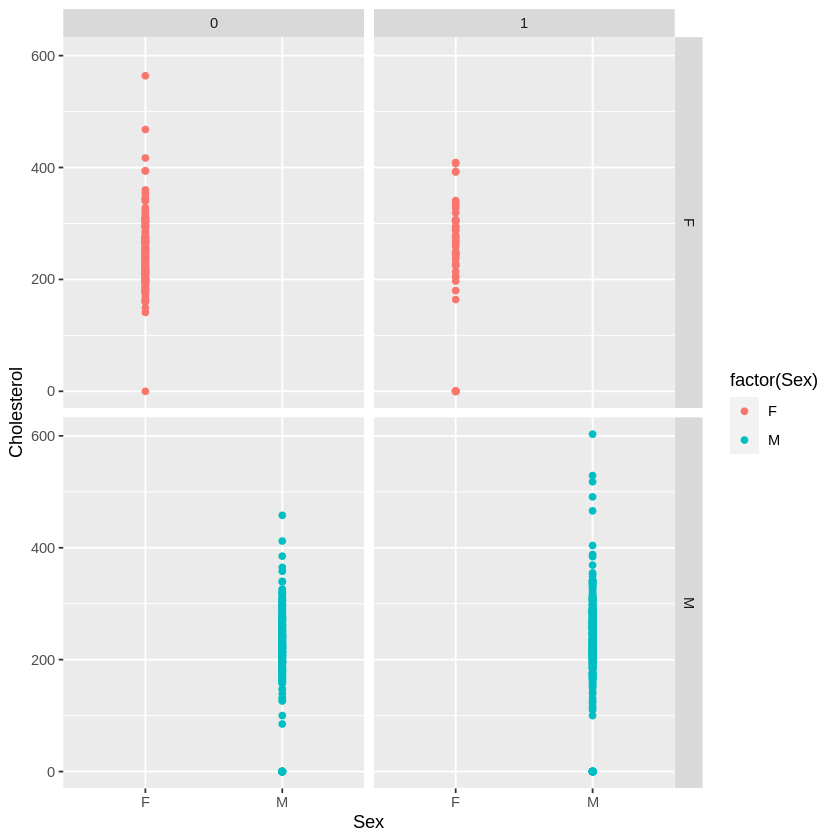
Mini Project-Heart

  1. Thanks to Dr. Saranya, for the valuable knowledge in R programming.
  2. From this mini project we can apply the knowledge and improve the part we miss out on and know which part we lack.
  3. Our advice to those who read this, is don't stop practicing and never give up.

Attached is our team data from the heart mini project.

  • Yatt
  • Zulhusaini
  • Azmi
  • Ahmad Ariff

download.png download (1).png download (2).png download (3).png ![alt text]download (4).png download (5).png

@saranyaravikumar

Dear Dr. Sara and all Air asia academy community or whoever that going to read this ,

I feel really amazing given the oppurtunity to get a deeper knowledge about data analytic from expert like Dr. Sara , Thank you so much for a really great experience on this journey . Im taking the Data Analytics course because i want to get to a deeper knowledge on how data can influence in our life .

1st day of class the introduction that Dr. Sara explained really blow my mind how data can make a bigger change in our life . Before this , i read a lot of data analyze summary but didnt know the process behind it .

eg in Stock market trading , we always need to read the summarize of daily , weekly and yearly price . Now i know how to summarize the data using R and start to find corelation between them.

In our mini project, i ask Dr. Sara many question to understand better about the process of finding corelation between our variables .What is dependent and undependent between one another . Well understanding about the data is the key in problem solving and finding outcomes .

Our datasets is about drug classification . How different types of Drug affect Blood Pressure , Cholesterol Level in different age and gender . Analyze the effect of Drug type towards heart condition patient .

My group consist of

  1. NUR AIN SHAFIKA BINTI ZAKARIA
  2. NUR HANIAH
  3. NUR AINA MUNIRAH
  4. SITI SABIHAH

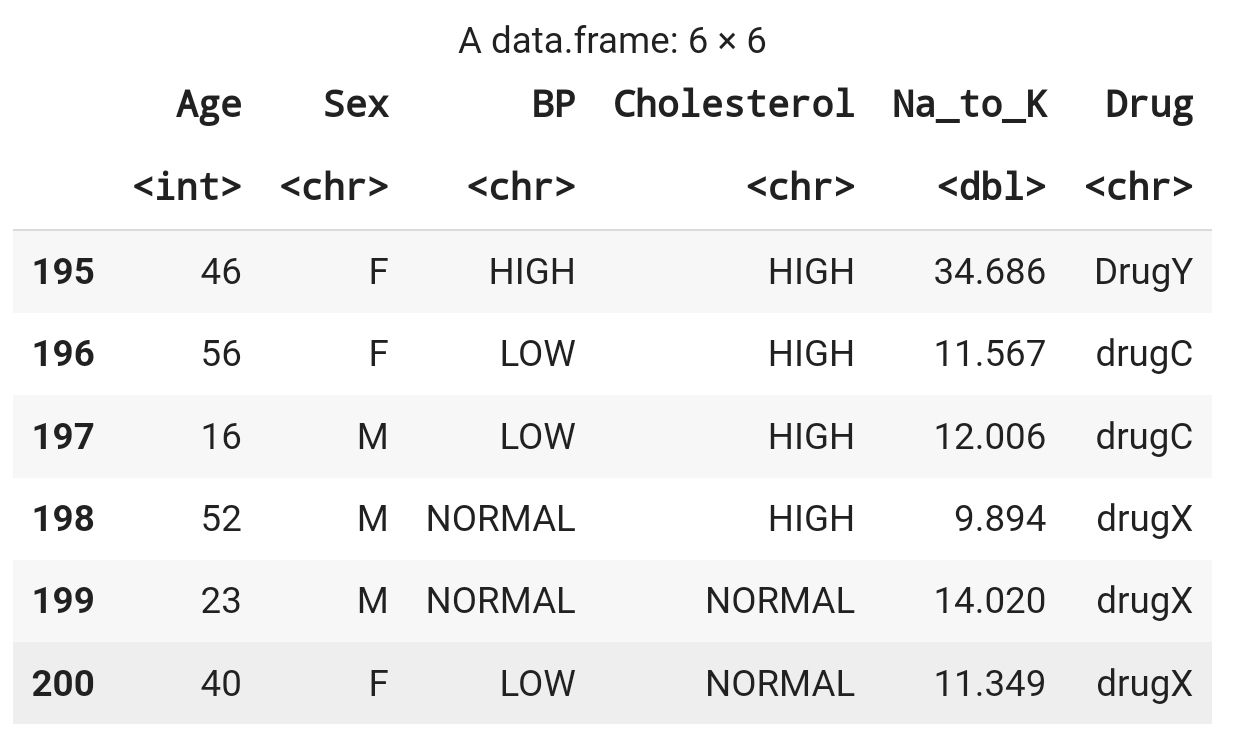
Dataframe
Screenshot_20231217_215628_Chrome.jpg

Data Understanding and Preprocessing

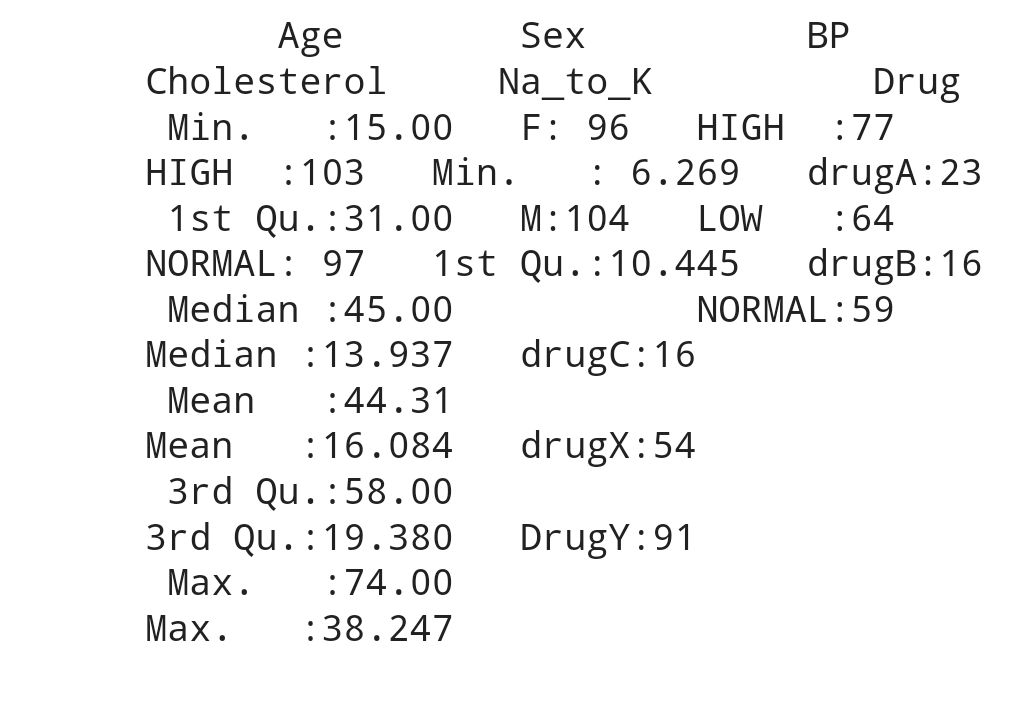
From the dataframe we can see 2 type of data which is numerical ( integer and double) , character (binary , nominal and identity). For character/categorical we con convert it to numerical and summarize it . There is no missing value and duplication . So we proceed to data visualization .
SmartSelect_20231217_220617_Chrome.jpg

Data Visualization using ggplot

SmartSelect_20231215_221425_Chrome.jpg SmartSelect_20231215_220525_Chrome.jpg

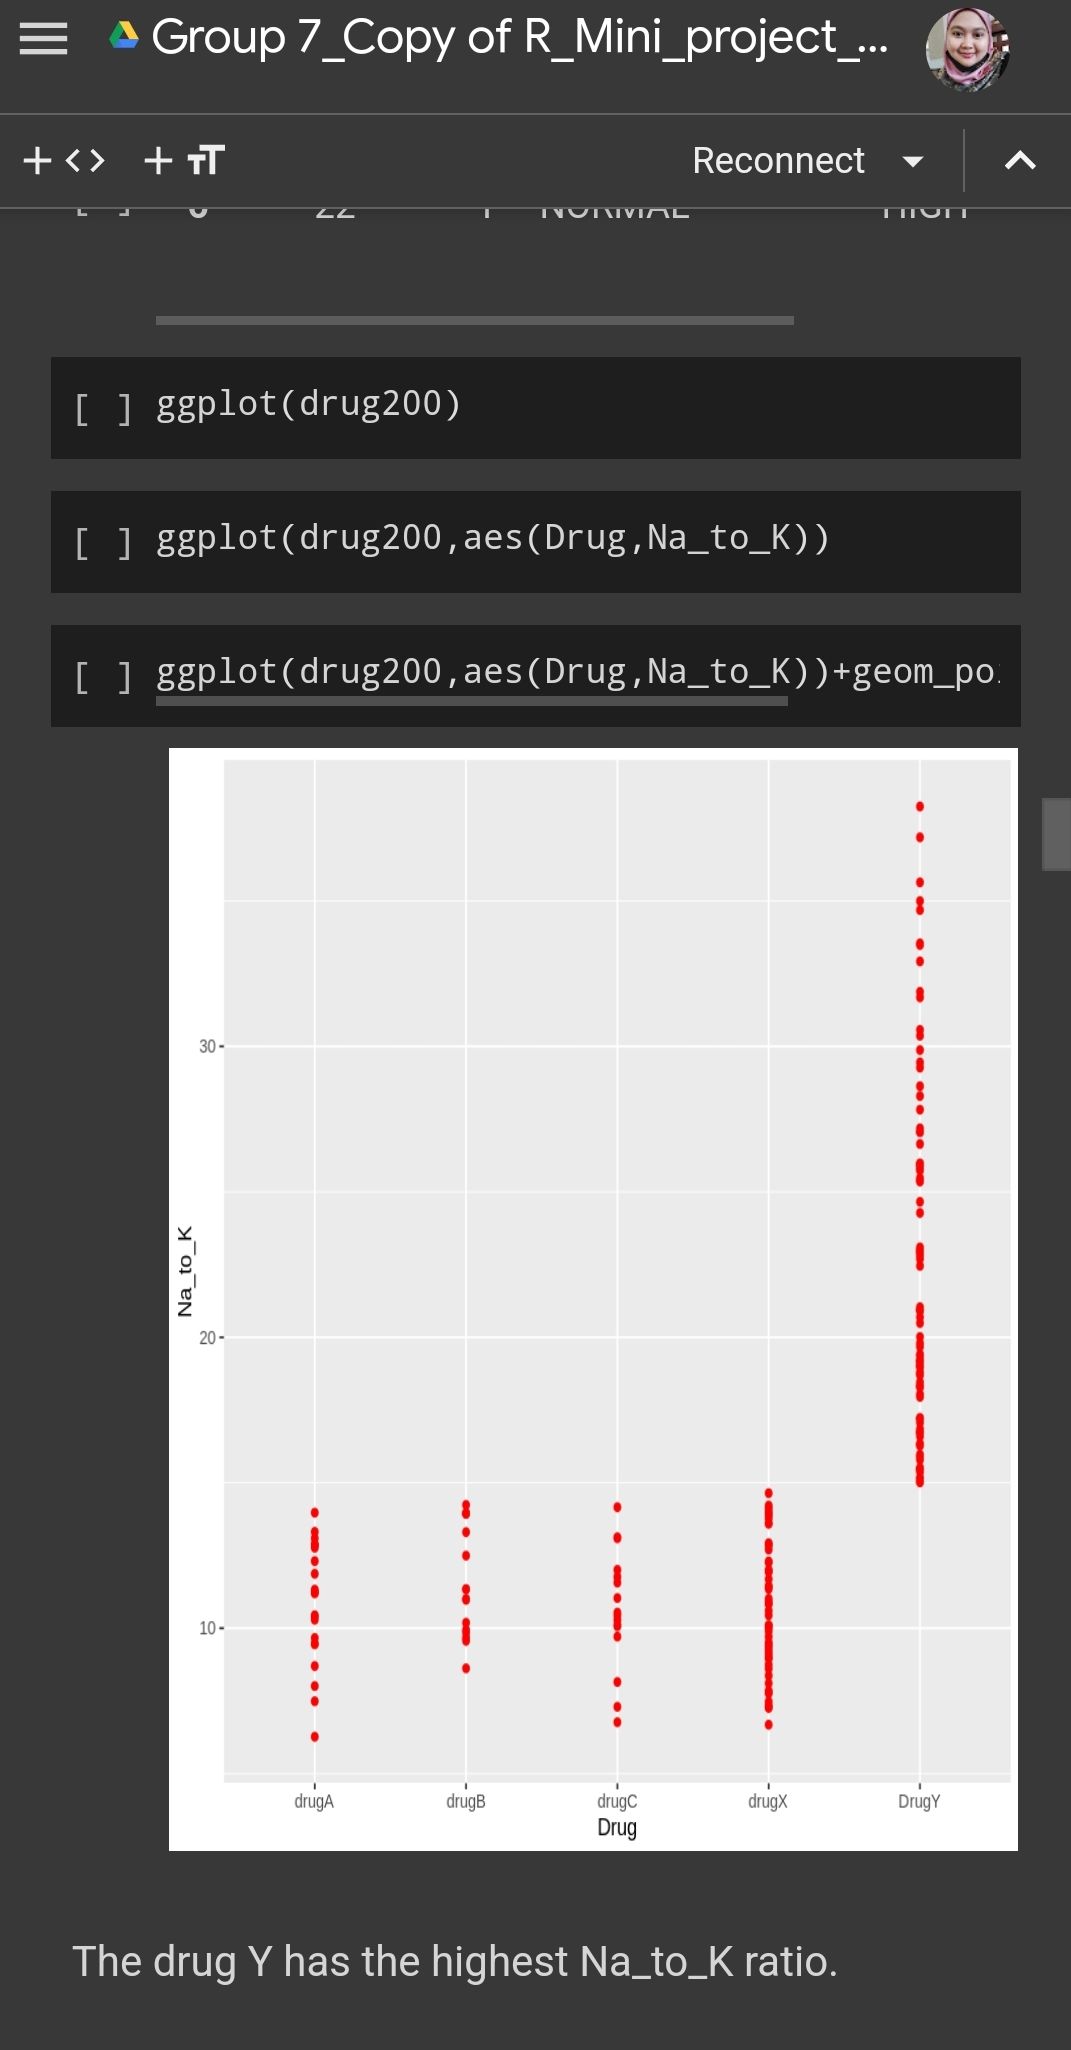
What we can see here is even Drug Y has the highest na to k value but it shows different type of blood pressure level , while Drug A and B shows a high blood pressure level . Its mean there some other factor that affecting the level of blood pressure not necessarily be related to Na to K ratio such as direct psychological effect on heart rate , electrolytes and mineral balance in the body , metabolic process (fluid retention , blood volume ) .
SmartSelect_20231215_223111_Chrome.jpg

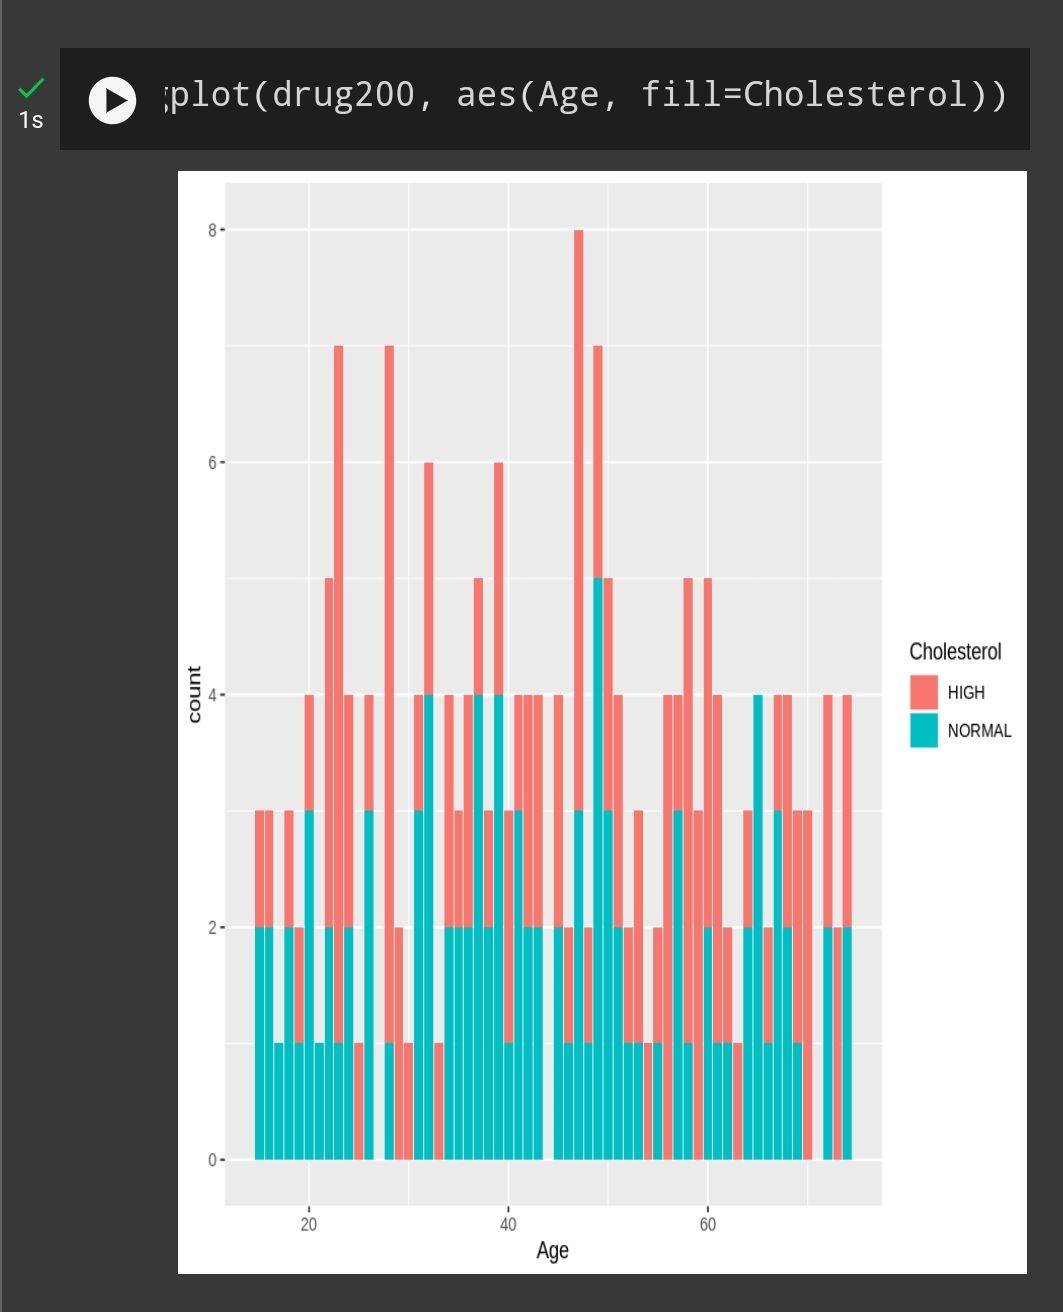
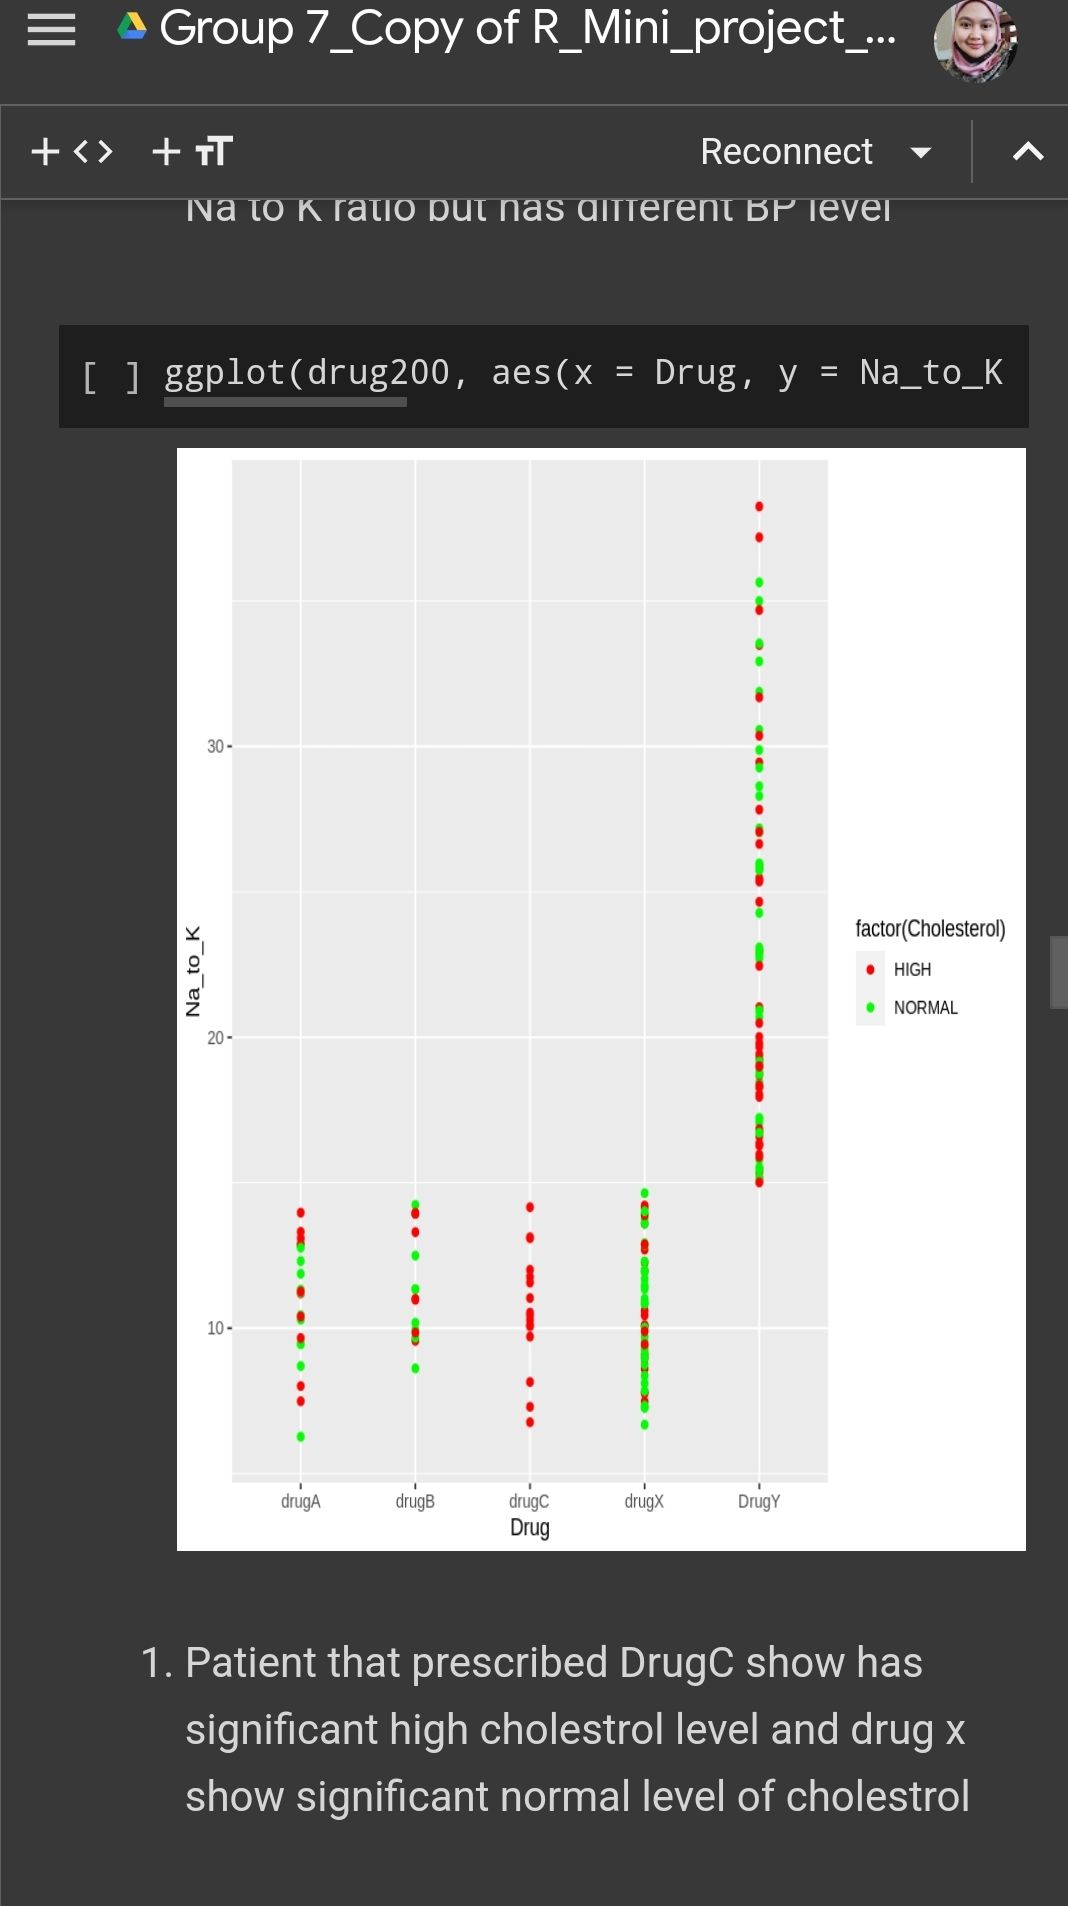
Same case like blood pressure , different drug has different effect towards cholestrol level . From the graph we can see that drug c has significant high level of cholestrol while drug x shows a significant normal level . Both type has lower na to k ratio . This is because certain drugs may have direct effect on lipid metabolism leading to increased cholestrol synthesis or decreased cholestrol clearance .
SmartSelect_20231215_232543_Chrome.jpg

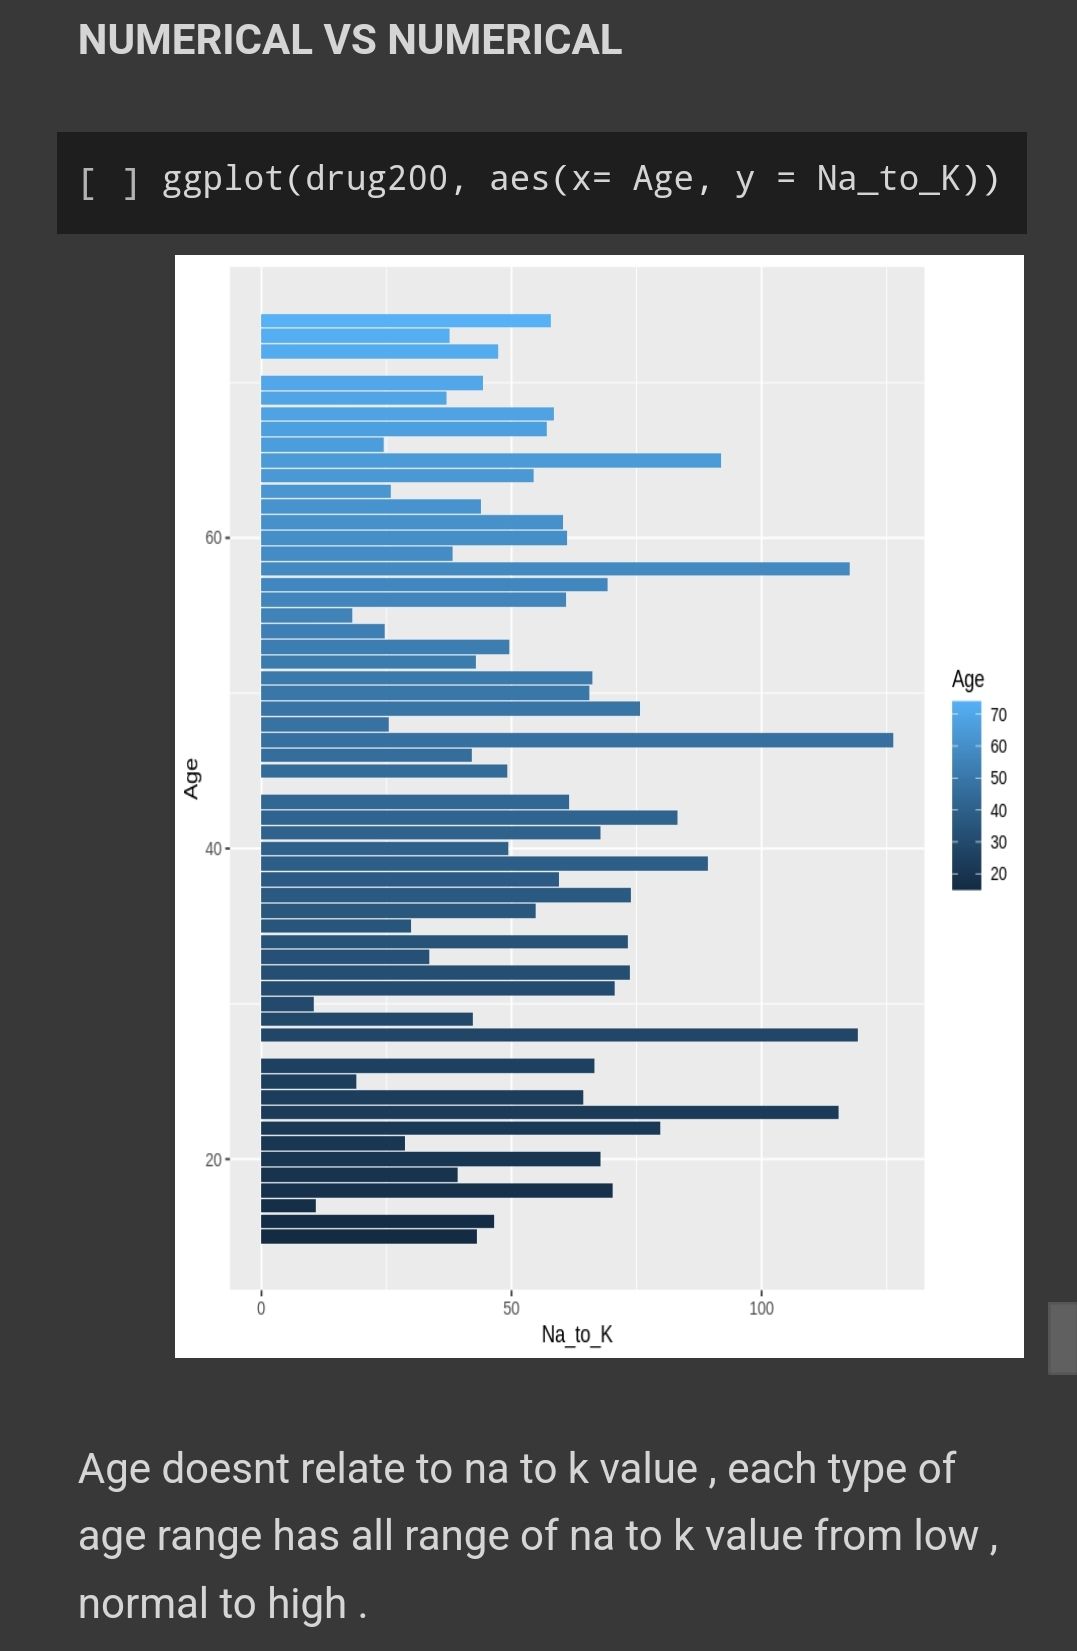
Many other factor to be considered to relate the age with na to k ratio like lifestyle and dietary pattern , genetics and overall health status .
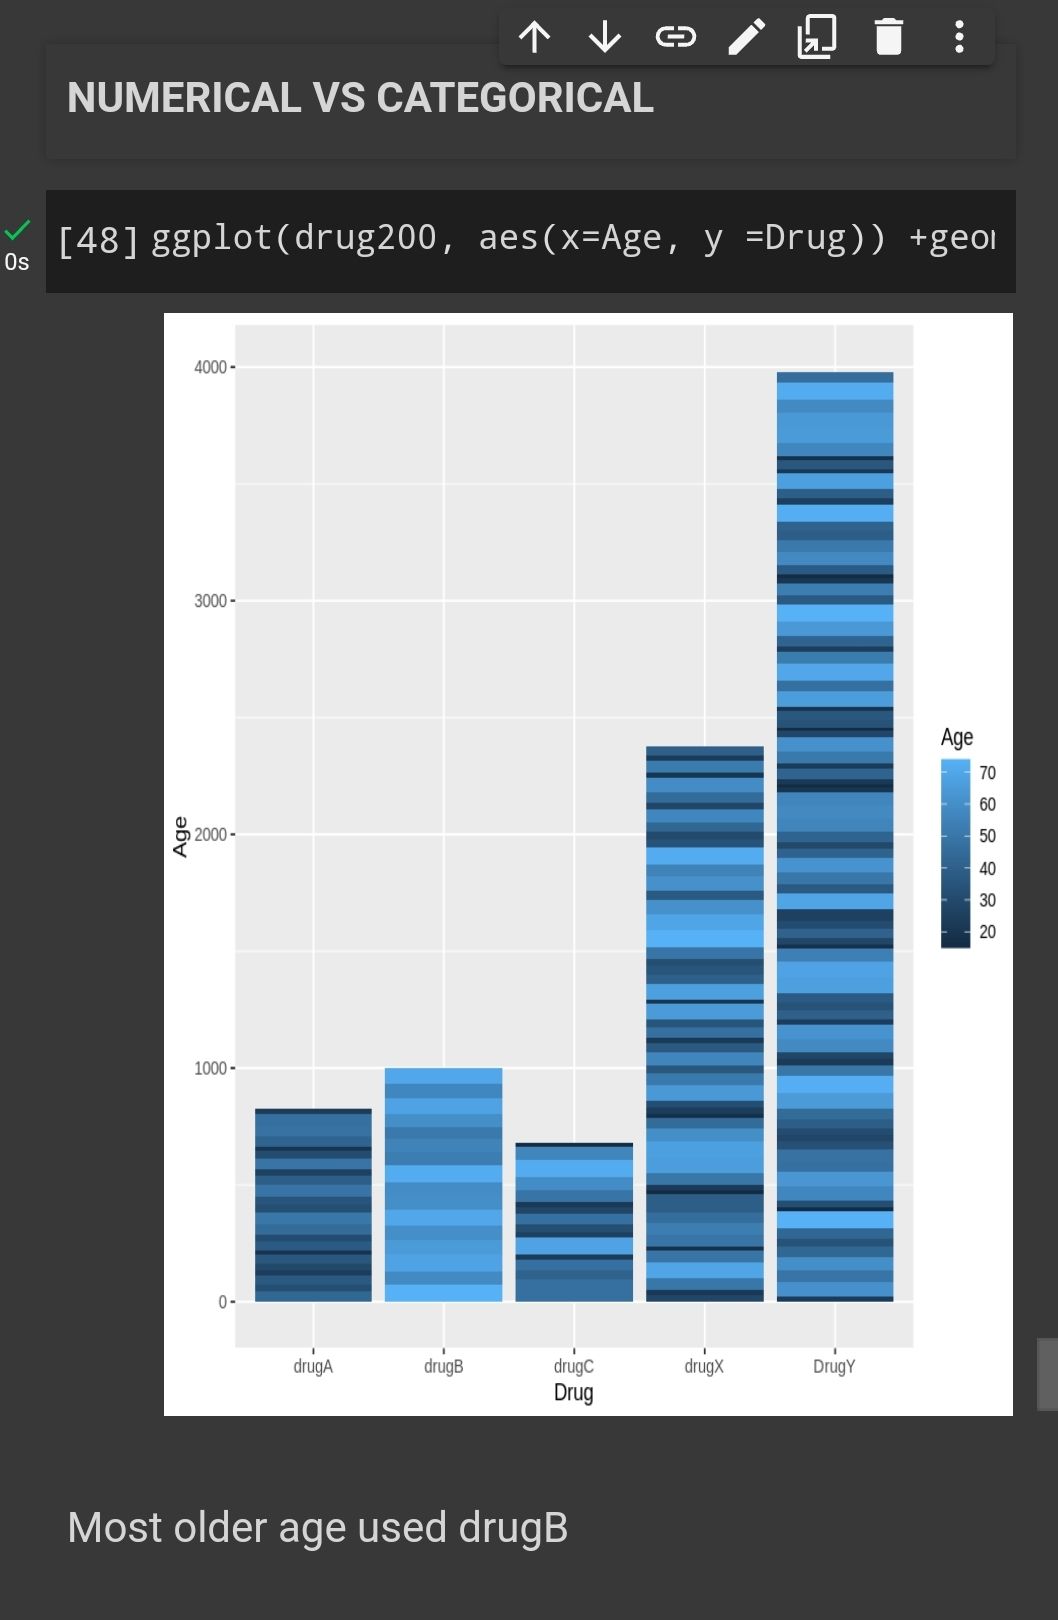
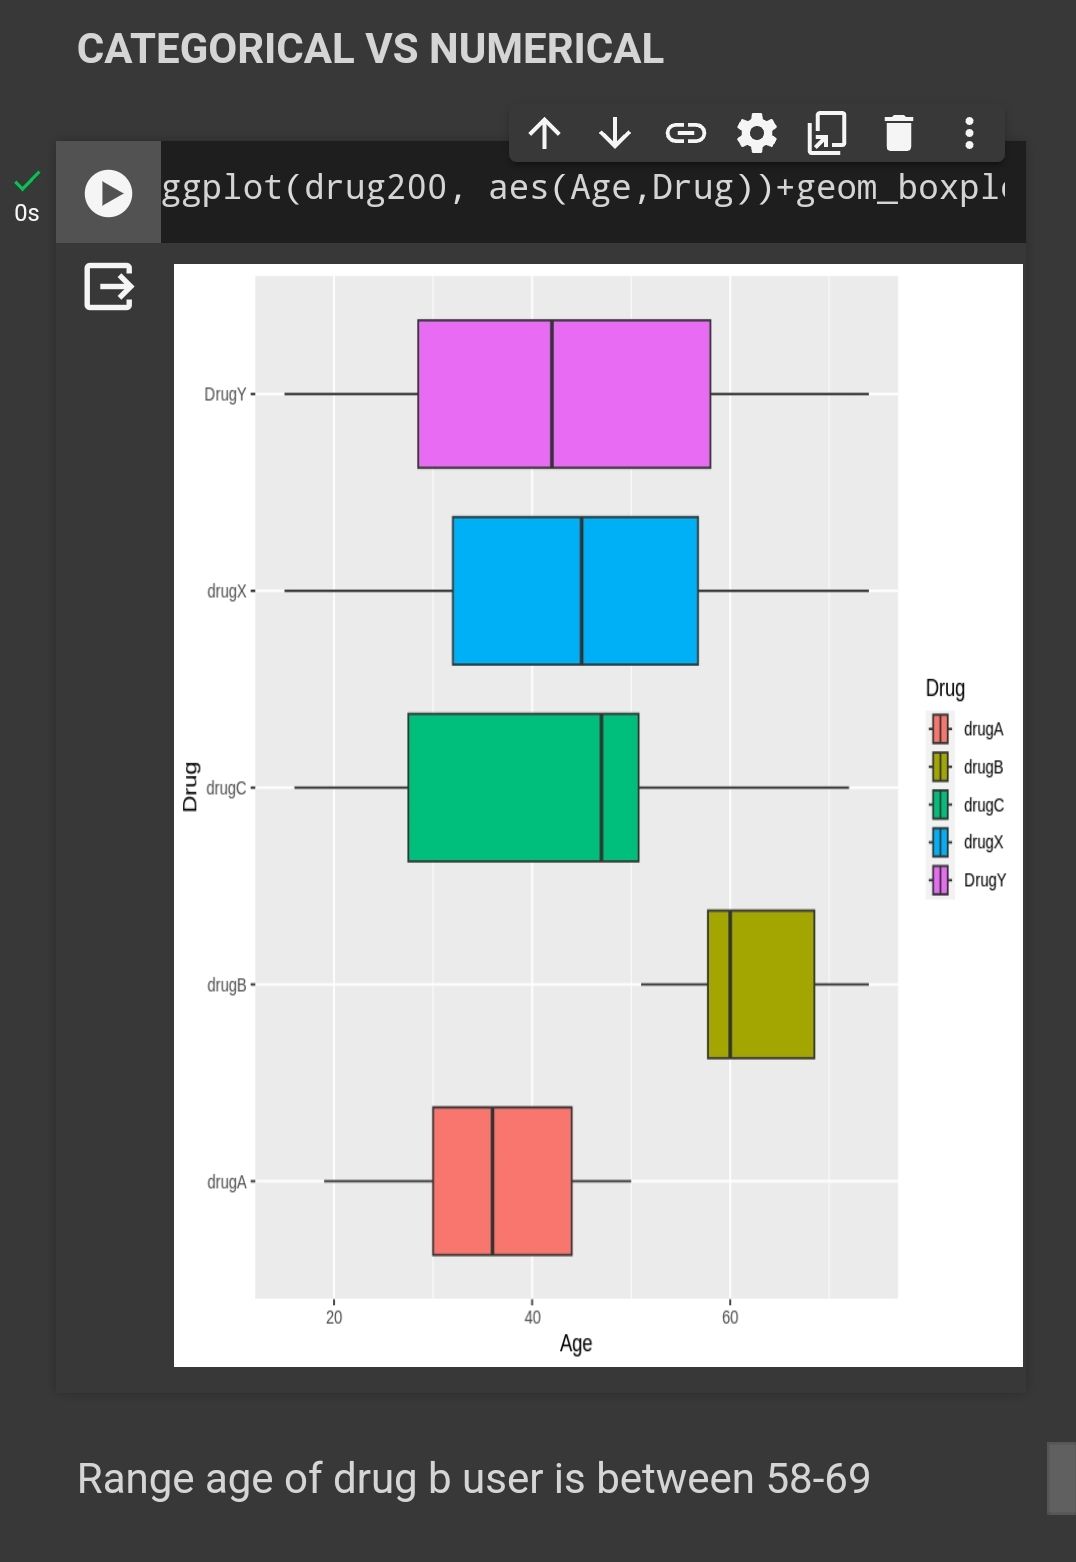
SmartSelect_20231215_234526_Chrome.jpg

SmartSelect_20231215_234750_Chrome.jpg

Age Vs BP

SmartSelect_20231216_002653_Chrome.jpg

Age Vs CL

SmartSelect_20231216_003926_Chrome.jpg

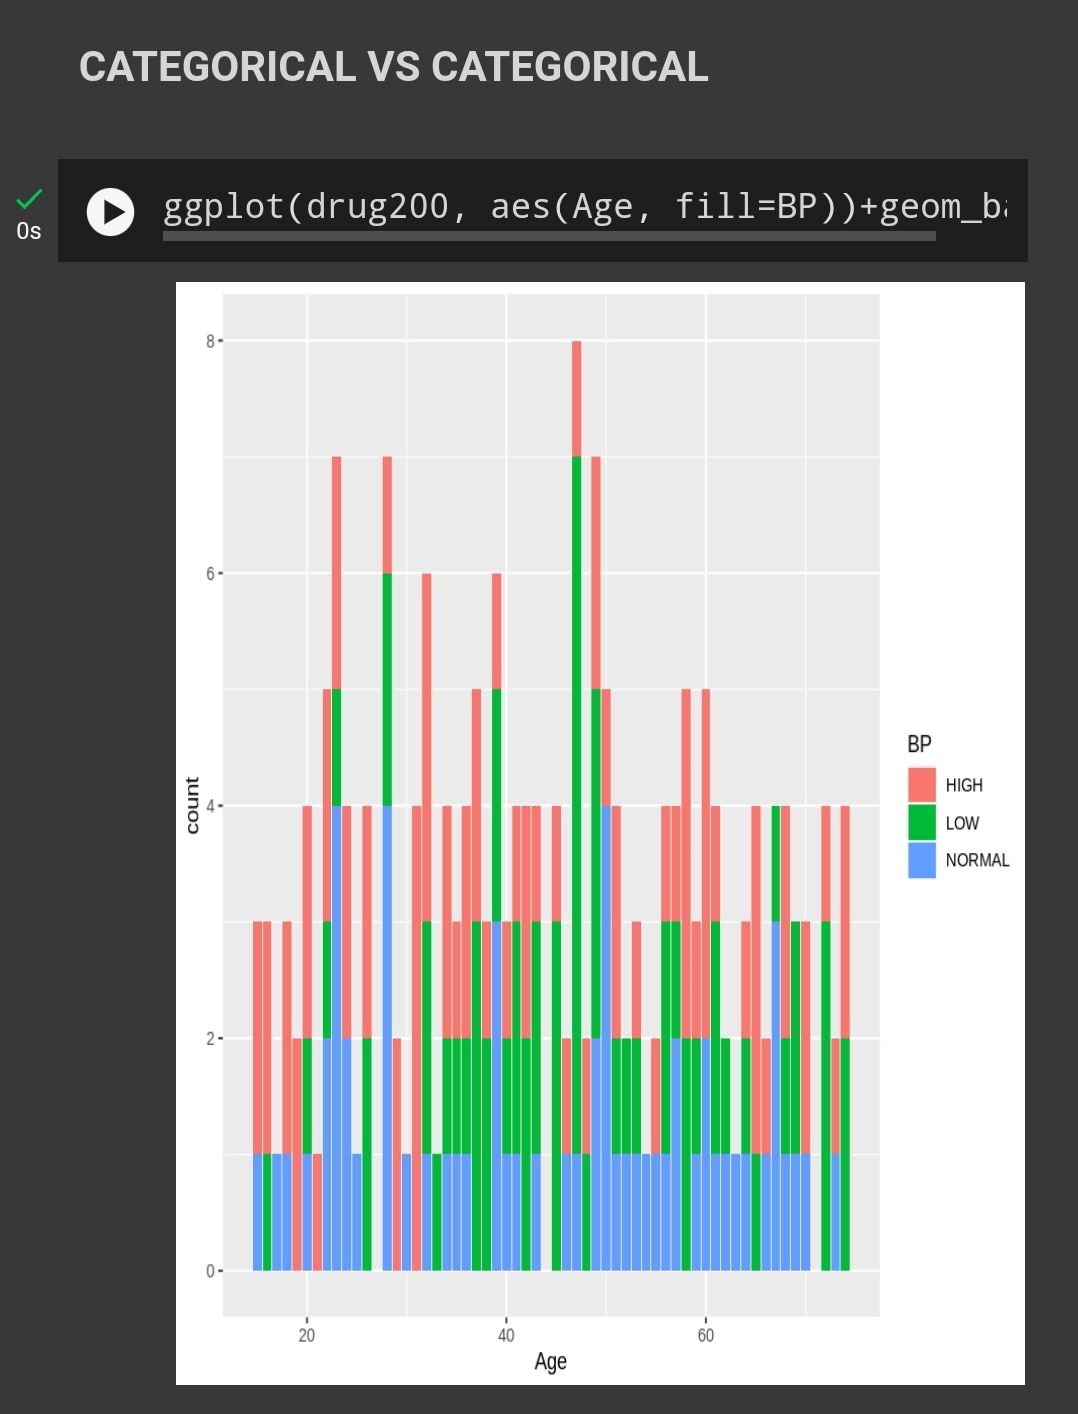
Blood pressure and Cholesterol level doesnt necessarily related to Age

Drug Vs Sex
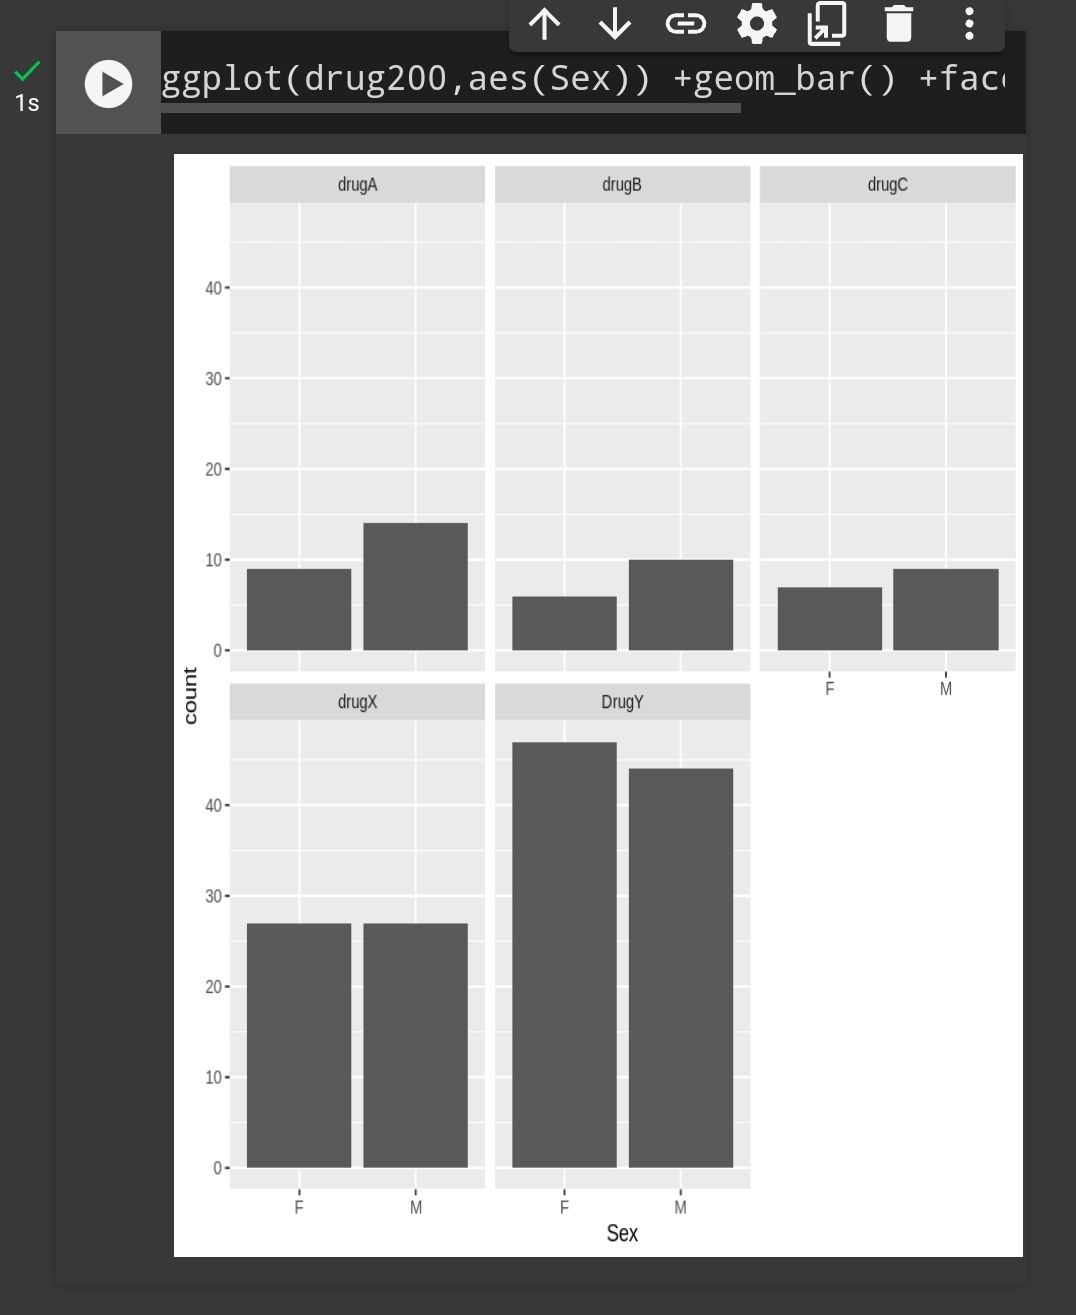
SmartSelect_20231216_004912_Chrome.jpg

More male taking drug a , b and c
More female taking drug y
While drug x suitable for male and female
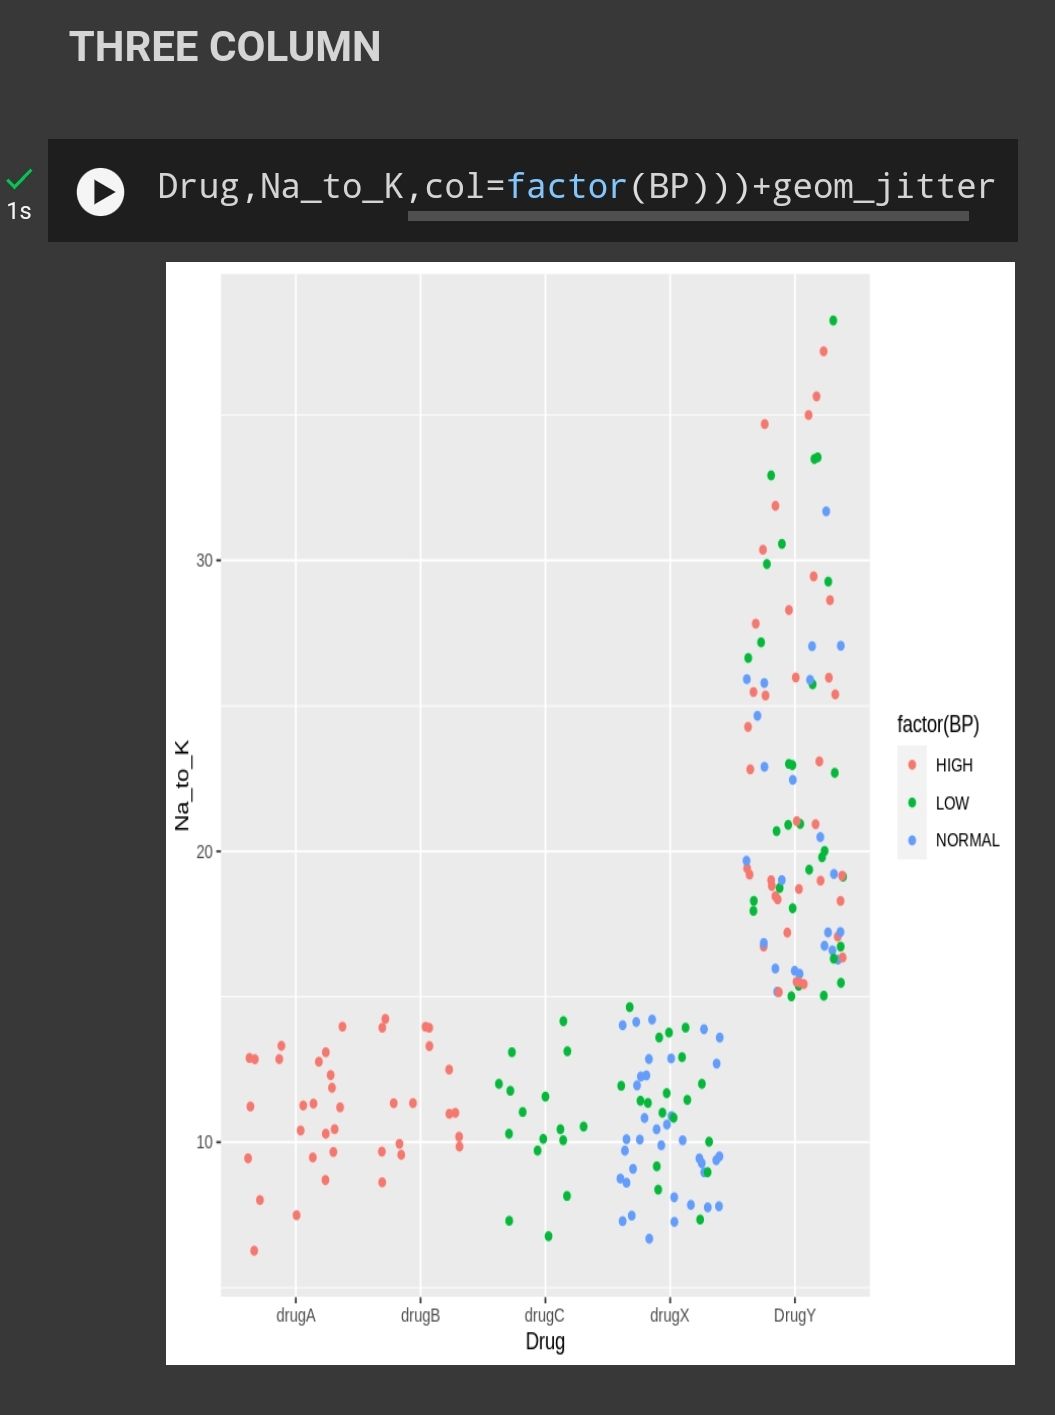
SmartSelect_20231216_005551_Chrome.jpg

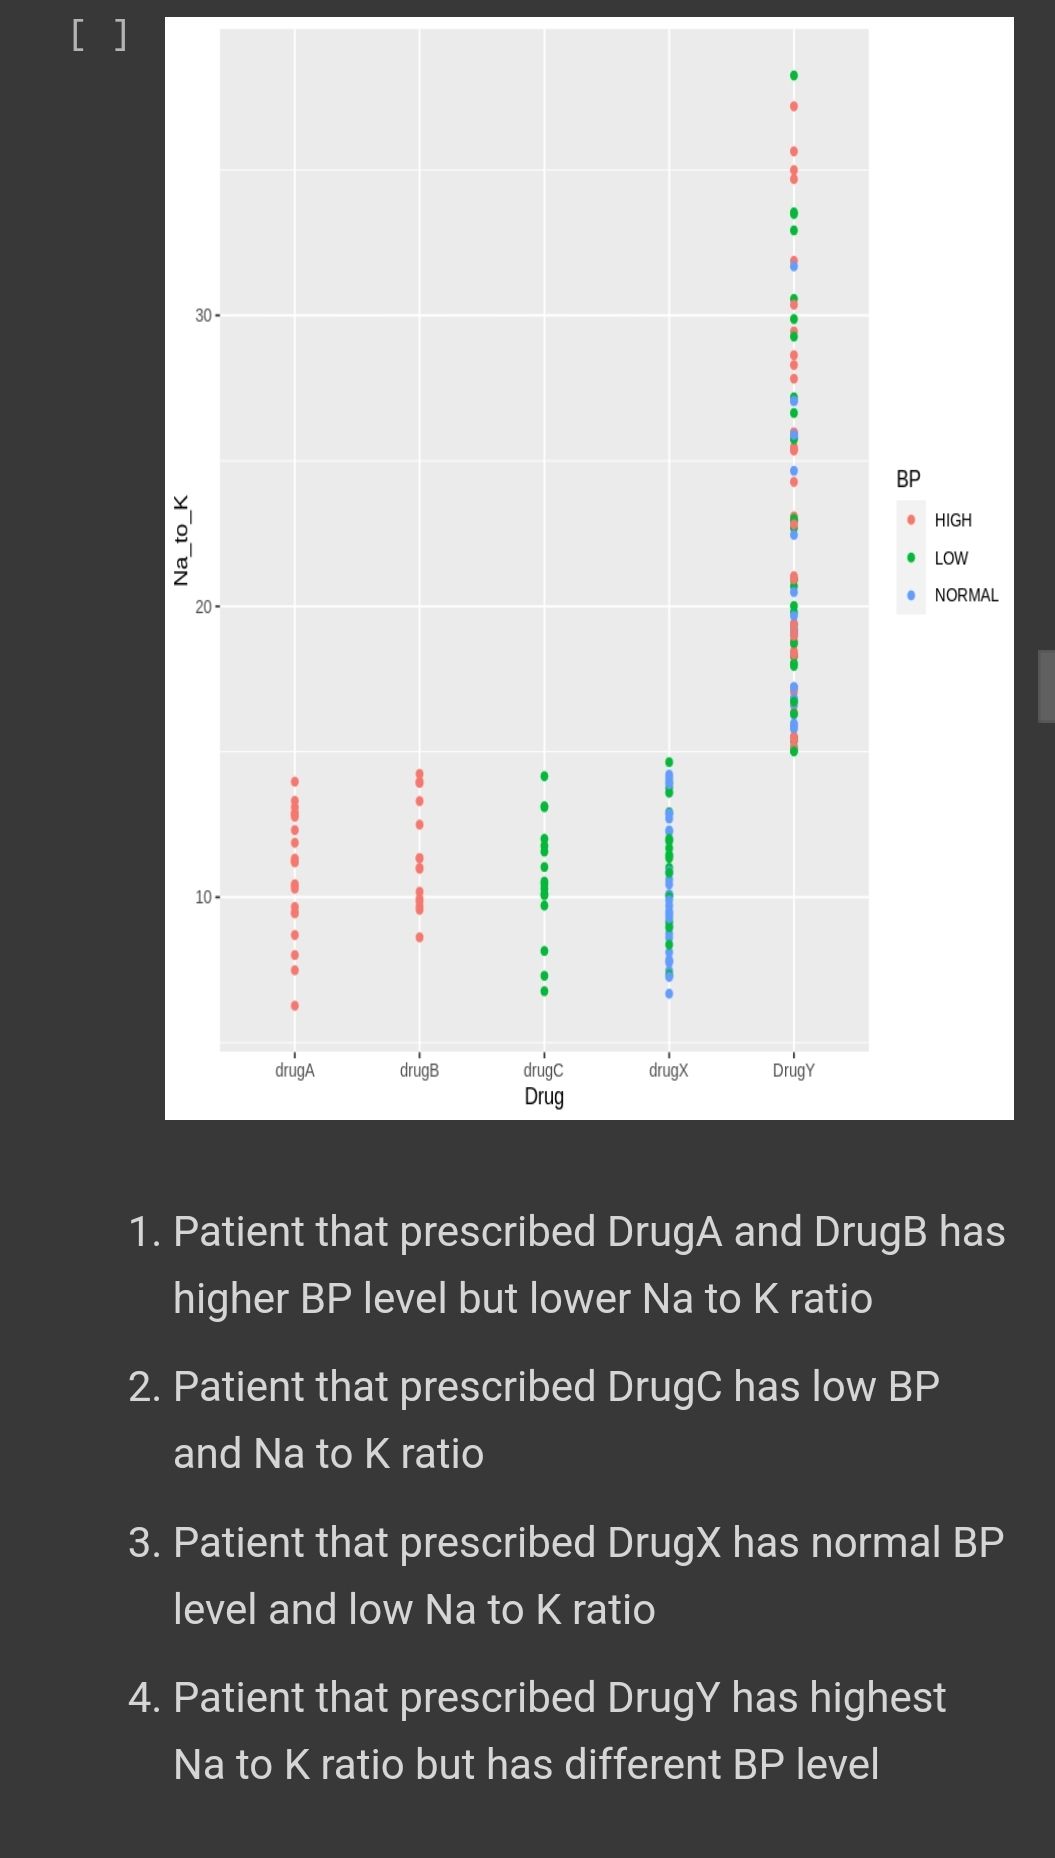
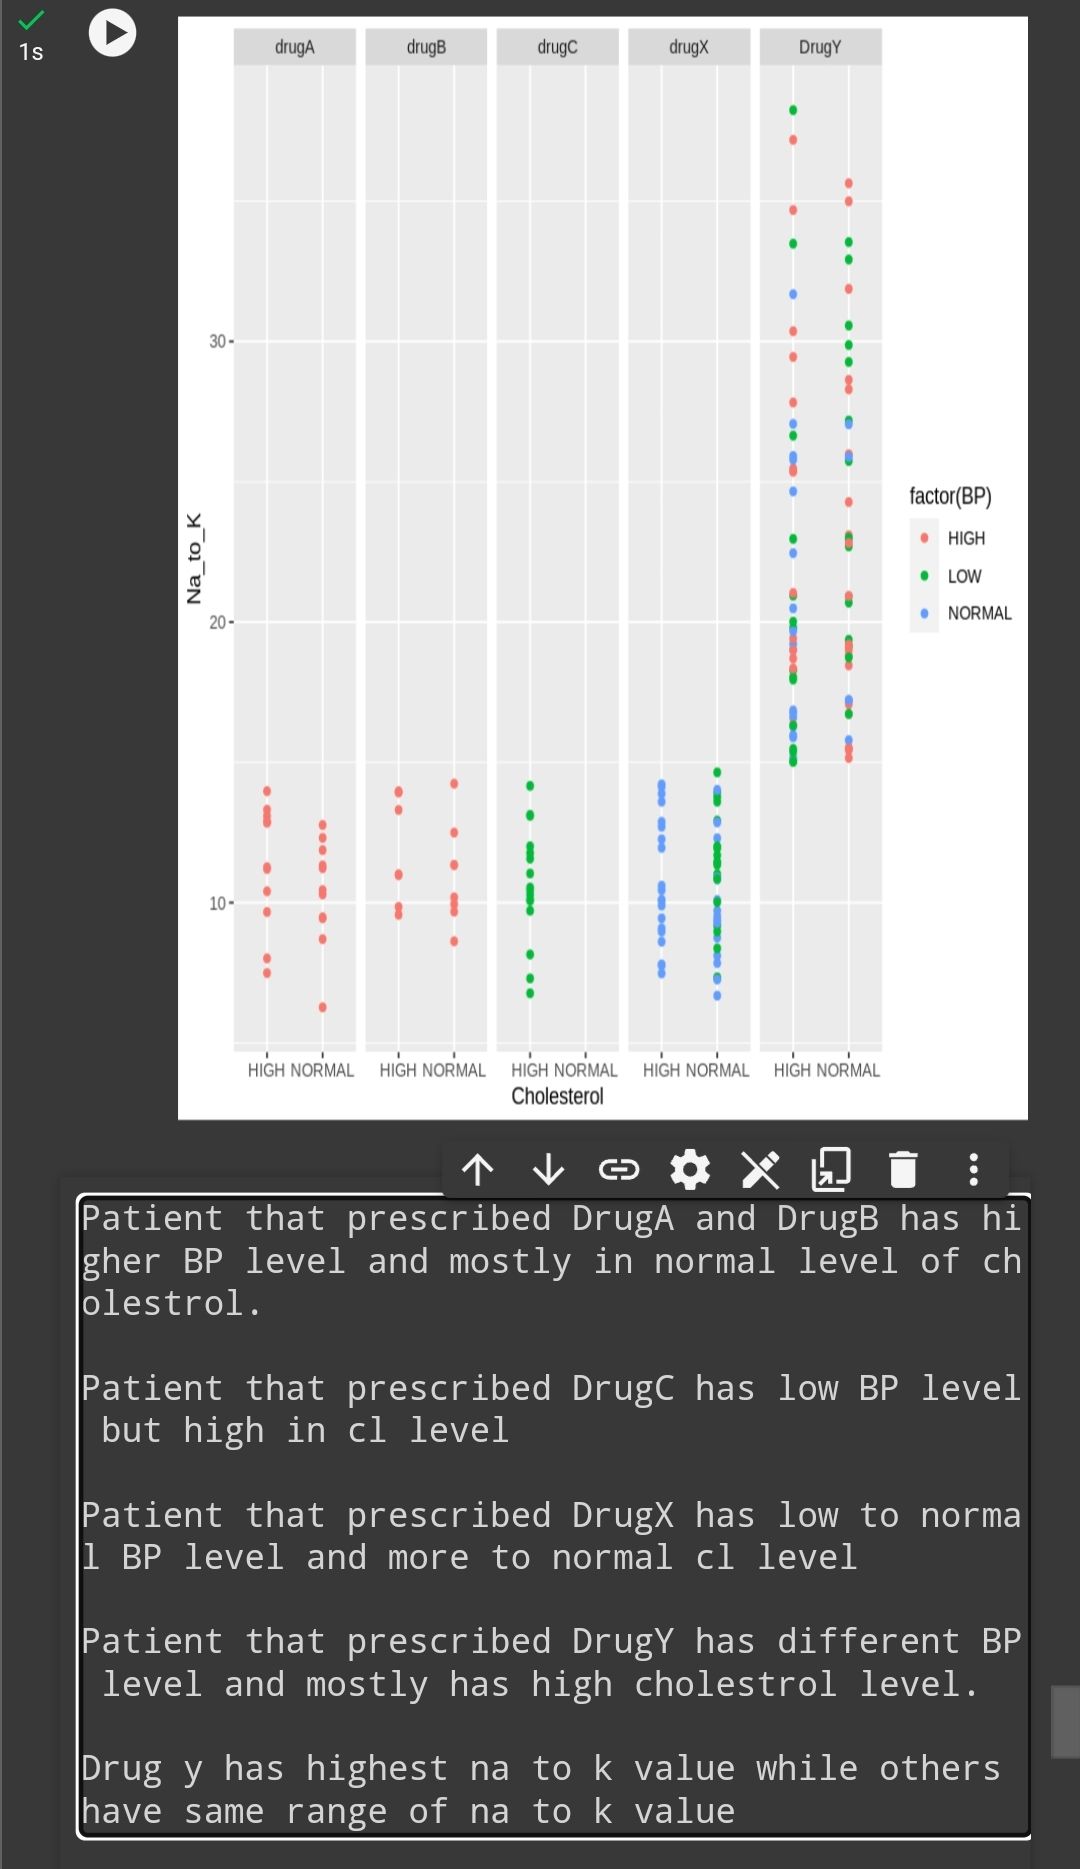
Patient that prescribed DrugA and DrugB has higher BP level but lower Na to K ratio.
Patient that prescribed DrugC has low BP and Na to K ratio.
Patient that prescribed DrugX has normal BP level and low Na to K ratio.
Patient that prescribed DrugY has highest Na to K ratio but has different BP level.
SmartSelect_20231216_012911_Chrome.jpg

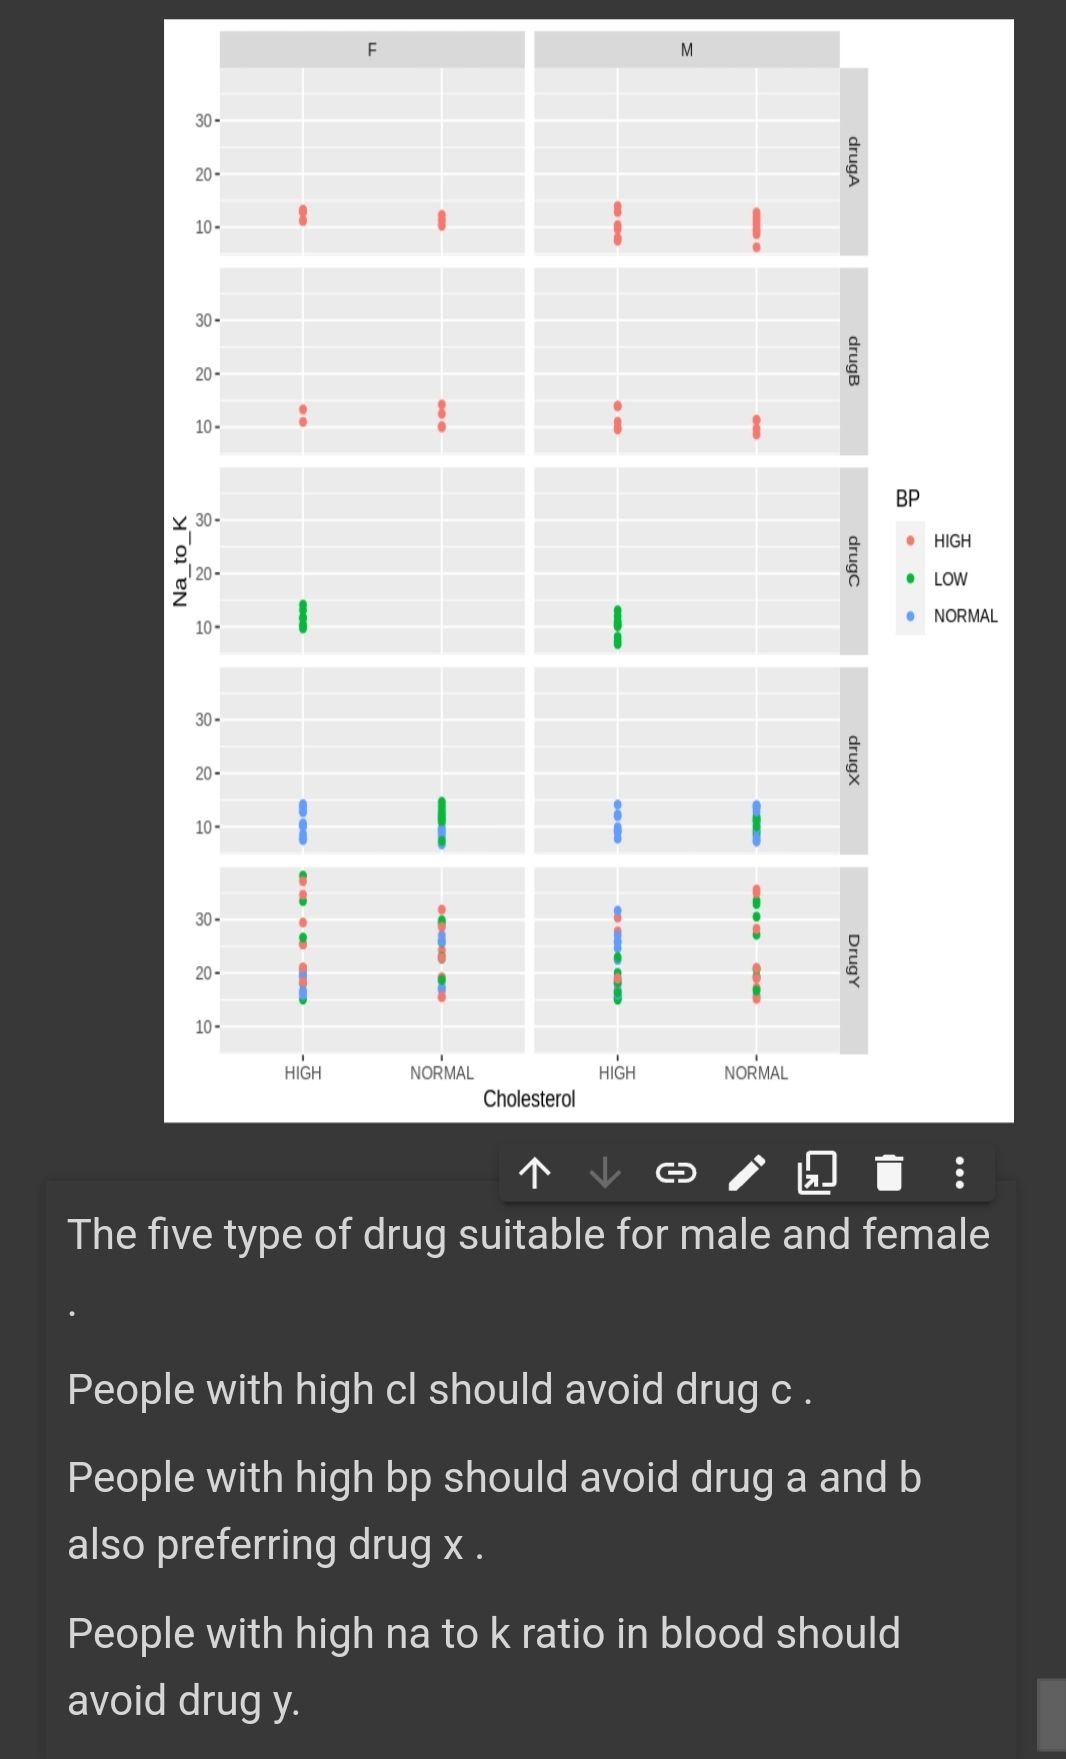
Each type of drug has its effect toward bp , cl and na to k ratio in blood . This data analyze needed by doctor to prescribe the best medication based on individual health status.
SmartSelect_20231216_085507_Chrome.jpg

Thats all our findings in given dataset about drug classification .
Last but not least , just want to quote some interesting words for my inspiration and all community in data analytics , " Big Data isn't about bits , its about talent " like Dr. Sara always says "BE BOLD "

~ayyinzakaria~

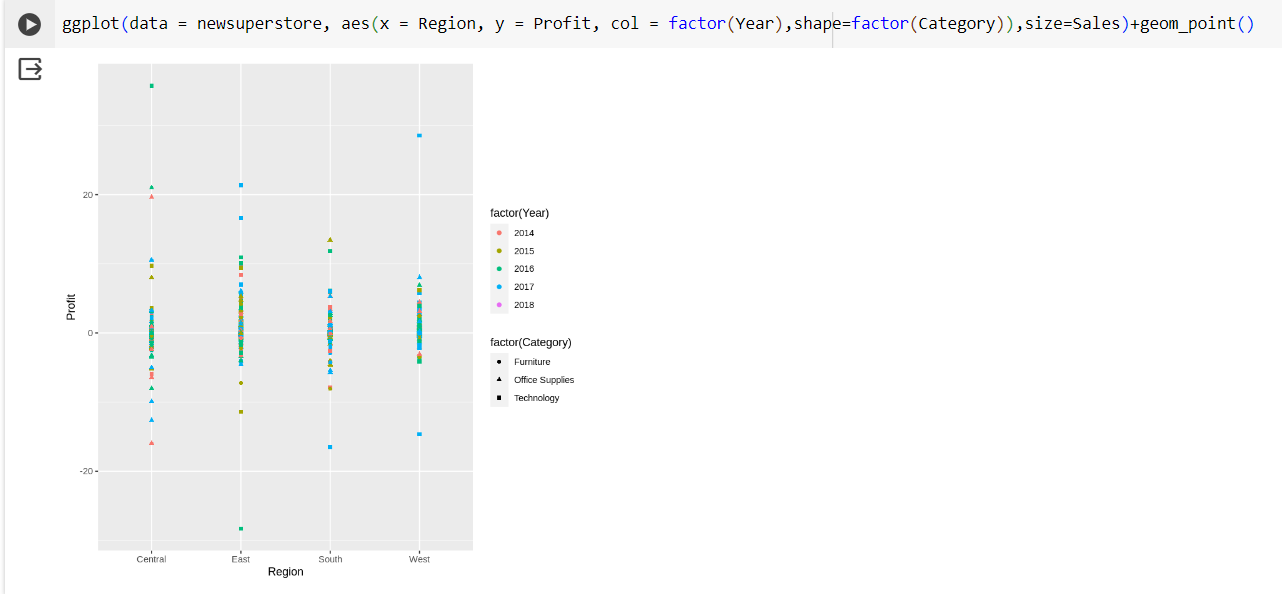
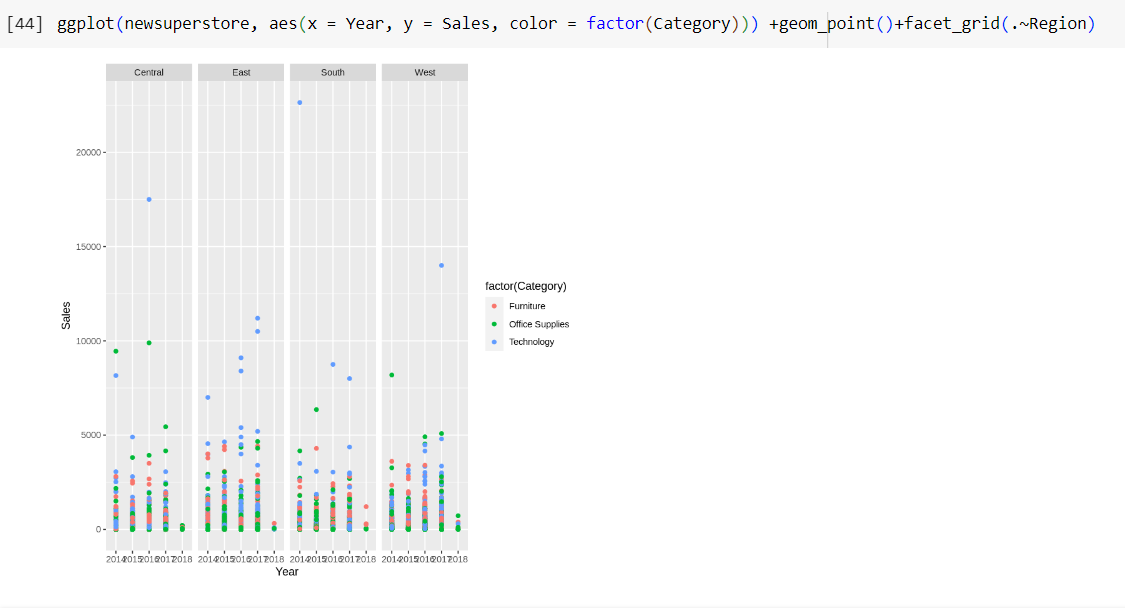
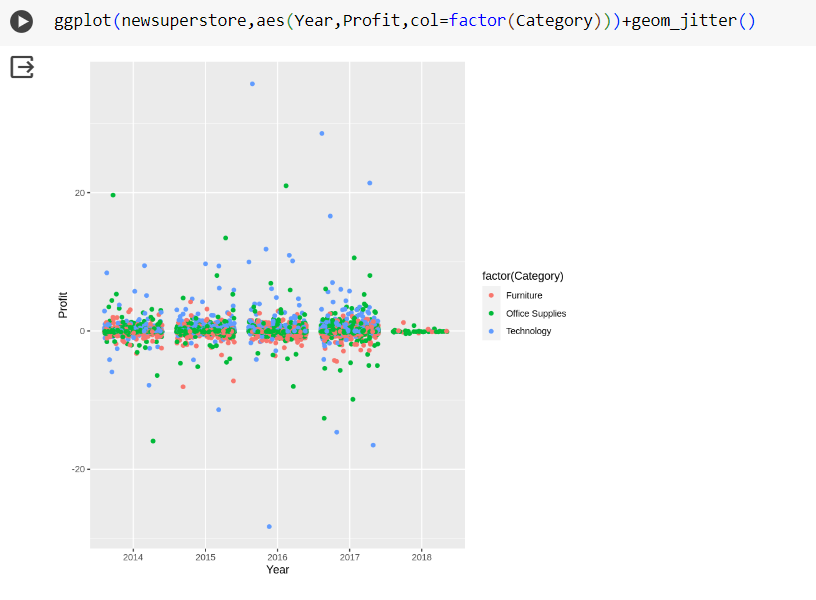
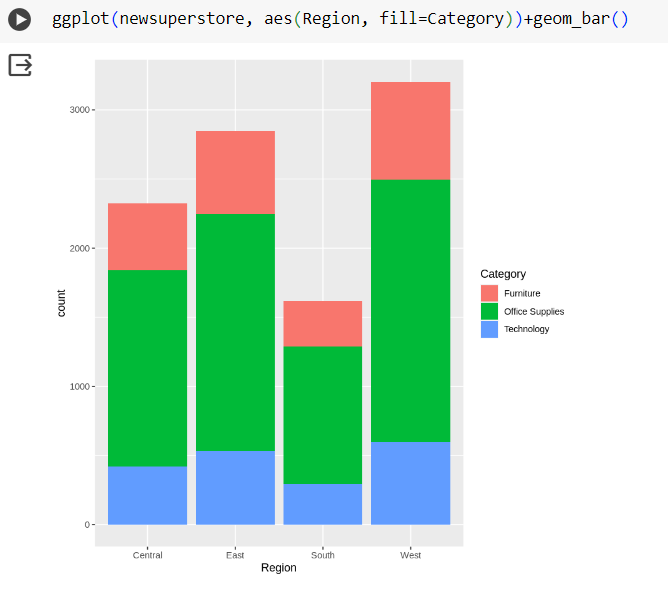
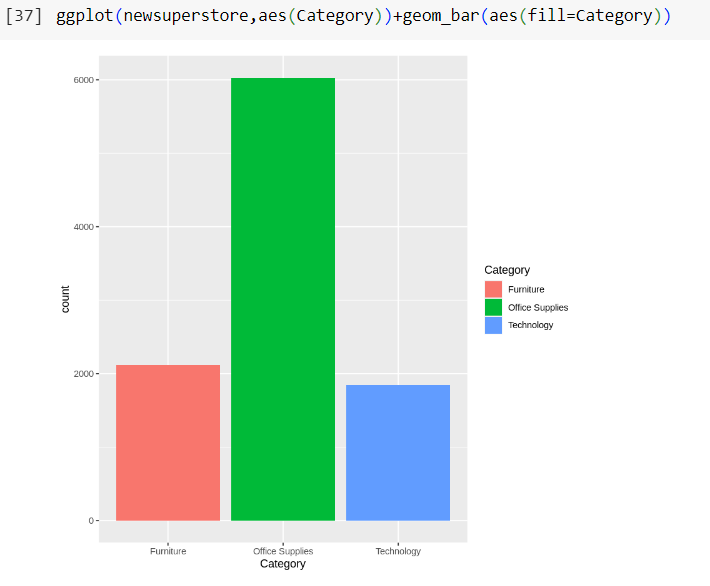
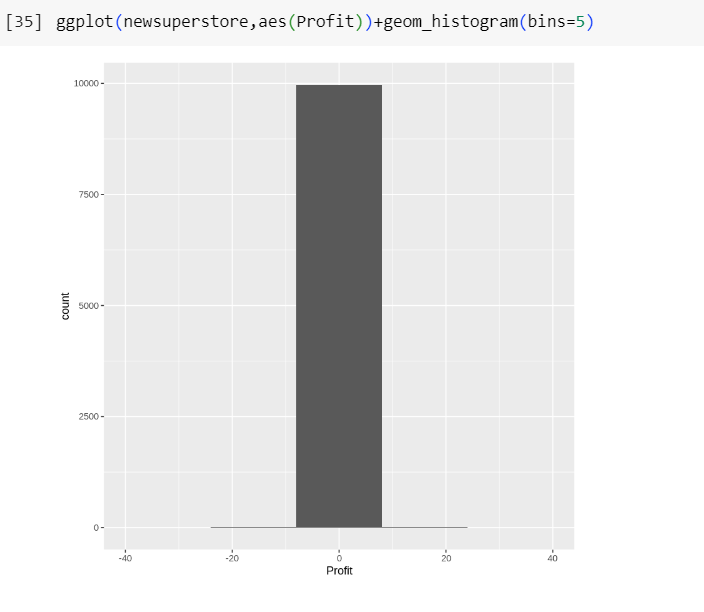
Me and my team, we decided to take on the Sample Superstore Dataset. We conducted a series of serious discussion on our understanding of the business before we started with Data Preprocessing, Data Exploration and Data Visualization with Google Collab. Determining the Dependent and Independent column.

We do the Data Cleaning Process by identify the Missing Data and Duplicate Data. After that we do the Data Scaling process to standardize the values.

The final process we do is the Visualization and Interpreting Data.

Thank you so much to Dr Saranya for being so patience and helpful in guiding us along the journey.

Group Members :

  • Noor Nabilah Shahida Binti Fadhil
  • Muhammad Zulfadhli Bin Aswadi
  • Aiman Haziq Bin Abdul Jabar
  • Nik Mohd Aiman Bin Alwai

Screenshot 2023-12-19 004138.png Screenshot 2023-12-19 004112.png Screenshot 2023-12-19 004058.png Screenshot 2023-12-19 004027.png Screenshot 2023-12-19 004010.png Screenshot 2023-12-19 003946.png

@saranyaravikumar
First of all, I would like to thank Dr @saranyaravikumar for guiding us through the boot camp and also AirAsia for the opportunity here.
At the start, my journey into the world of data analytics and R programming has been wonderful and it is such a dream for me because it is like a dream come true which was just a month ago that I decided to go deeper for Data Analytics. I also had a terrific time attending physical classes and meeting new people to help me start my new chapter in the data world. Because there will be a strong demand for data analytics in the following year, my heart erupted.

I've been collaborating with teammates, @Yushi ๐Ÿ˜ƒ & Haziq MudZakir๐Ÿ˜€ on an R programming project. The project is about telecom provider churn. This was the first time I heard the term "Churn," and it has given me a rollercoaster ride because I need to complete the job. Nevertheless, in a little amount of time, we were able to exceed the presentation. This is our video presentation on the churn dataset analysis and a few sample visualizations that we managed to create.
Churn in R Programming Project

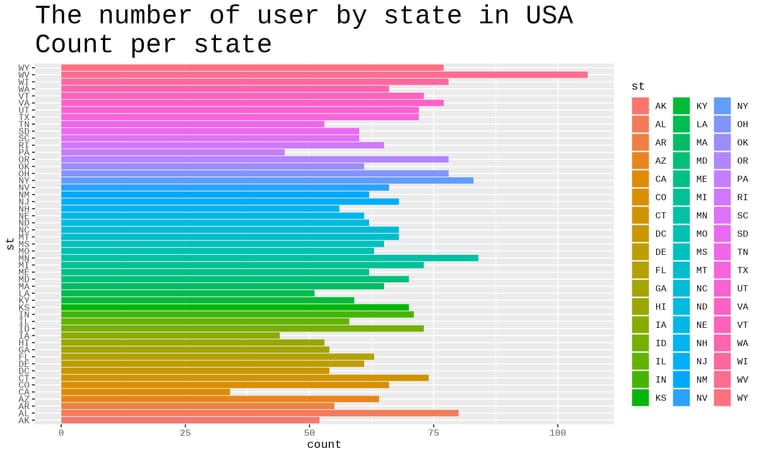
The number of user by state in USA7e5cc820-c1f1-4578-99a5-0c2c4d581fde-OneVariableCat.jpg

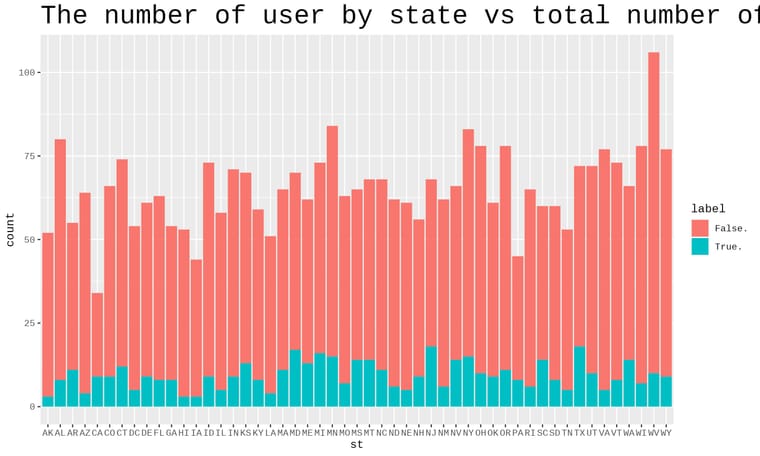
The number of users by state vs the count of user that churn
b86fe8ca-beff-4896-aff9-95be8fb0a276-TwoVariable3.jpg

Five Variable Chart
f6250170-c93d-4cf1-8e5e-216ff156ada8-FiveVariable.jpg

Still, it's a priceless memory that I might not be able to recreate anywhere. Everyone I've met here has been kind and eager to offer their knowledge and experiences.

My advice to all of my friends is that to learn something new, we must be passionate about the course or subject. That will then motivate you to give it your all๐Ÿ˜