@saranyaravikumar
Dear Dr. Sara and all Air asia academy community or whoever that going to read this ,
I feel really amazing given the oppurtunity to get a deeper knowledge about data analytic from expert like Dr. Sara , Thank you so much for a really great experience on this journey . Im taking the Data Analytics course because i want to get to a deeper knowledge on how data can influence in our life .
1st day of class the introduction that Dr. Sara explained really blow my mind how data can make a bigger change in our life . Before this , i read a lot of data analyze summary but didnt know the process behind it .
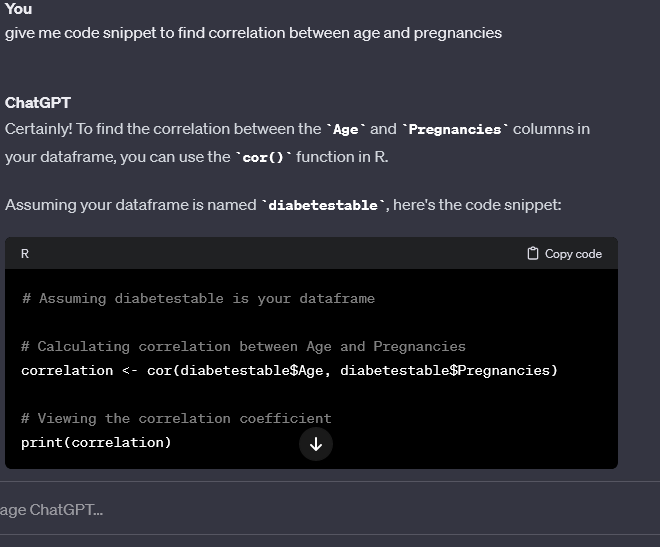
eg in Stock market trading , we always need to read the summarize of daily , weekly and yearly price . Now i know how to summarize the data using R and start to find corelation between them.
In our mini project, i ask Dr. Sara many question to understand better about the process of finding corelation between our variables .What is dependent and undependent between one another . Well understanding about the data is the key in problem solving and finding outcomes .
Our datasets is about drug classification . How different types of Drug affect Blood Pressure , Cholesterol Level in different age and gender . Analyze the effect of Drug type towards heart condition patient .
My group consist of
- NUR AIN SHAFIKA BINTI ZAKARIA
- NUR HANIAH
- NUR AINA MUNIRAH
- SITI SABIHAH
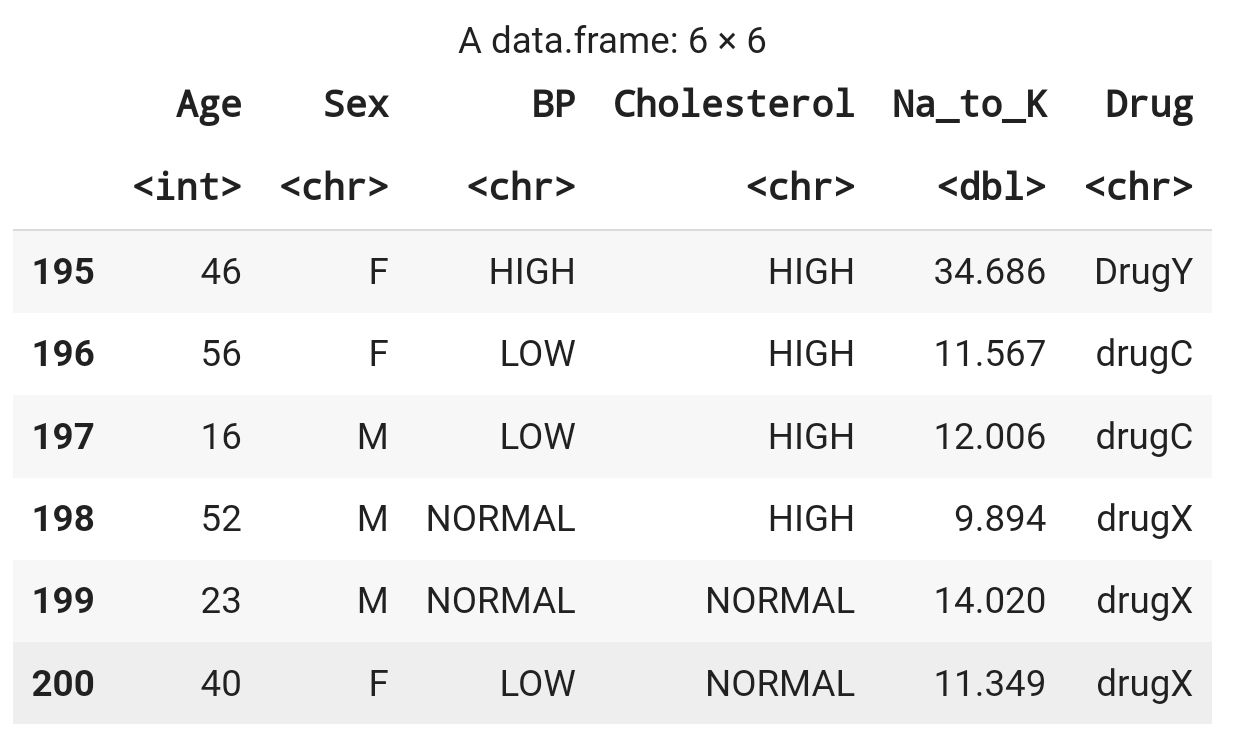
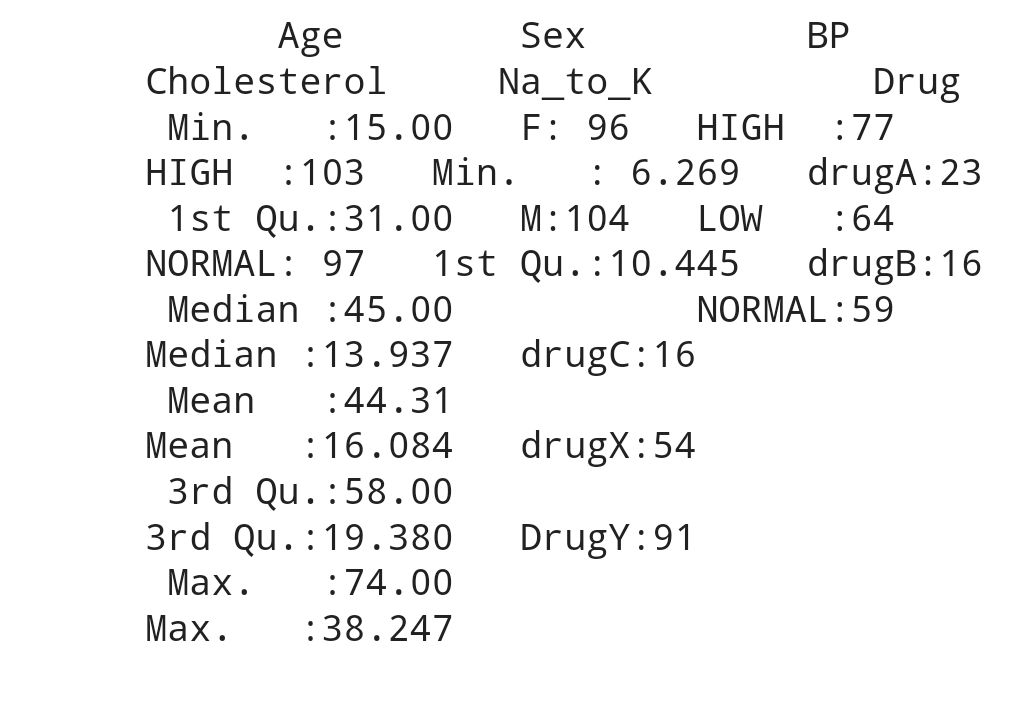
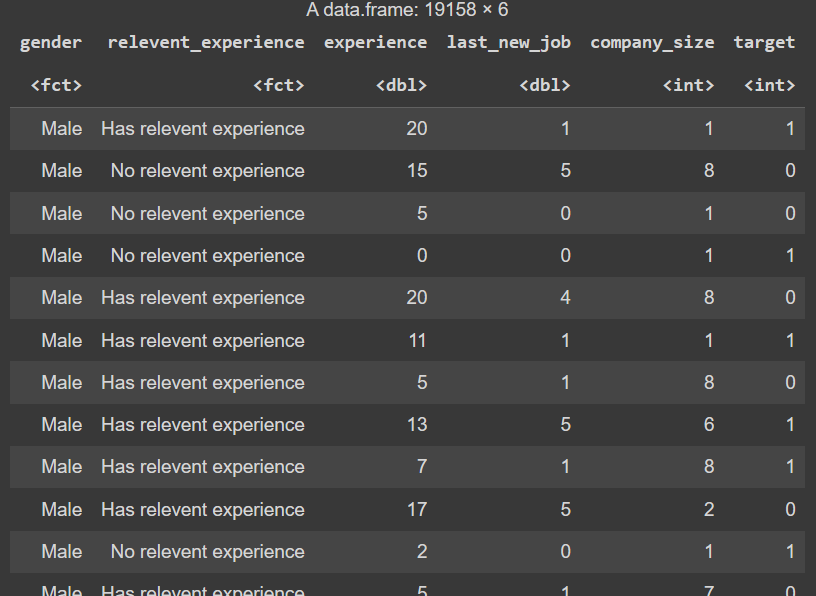
Dataframe
Data Understanding and Preprocessing
From the dataframe we can see 2 type of data which is numerical ( integer and double) , character (binary , nominal and identity). For character/categorical we con convert it to numerical and summarize it . There is no missing value and duplication . So we proceed to data visualization .
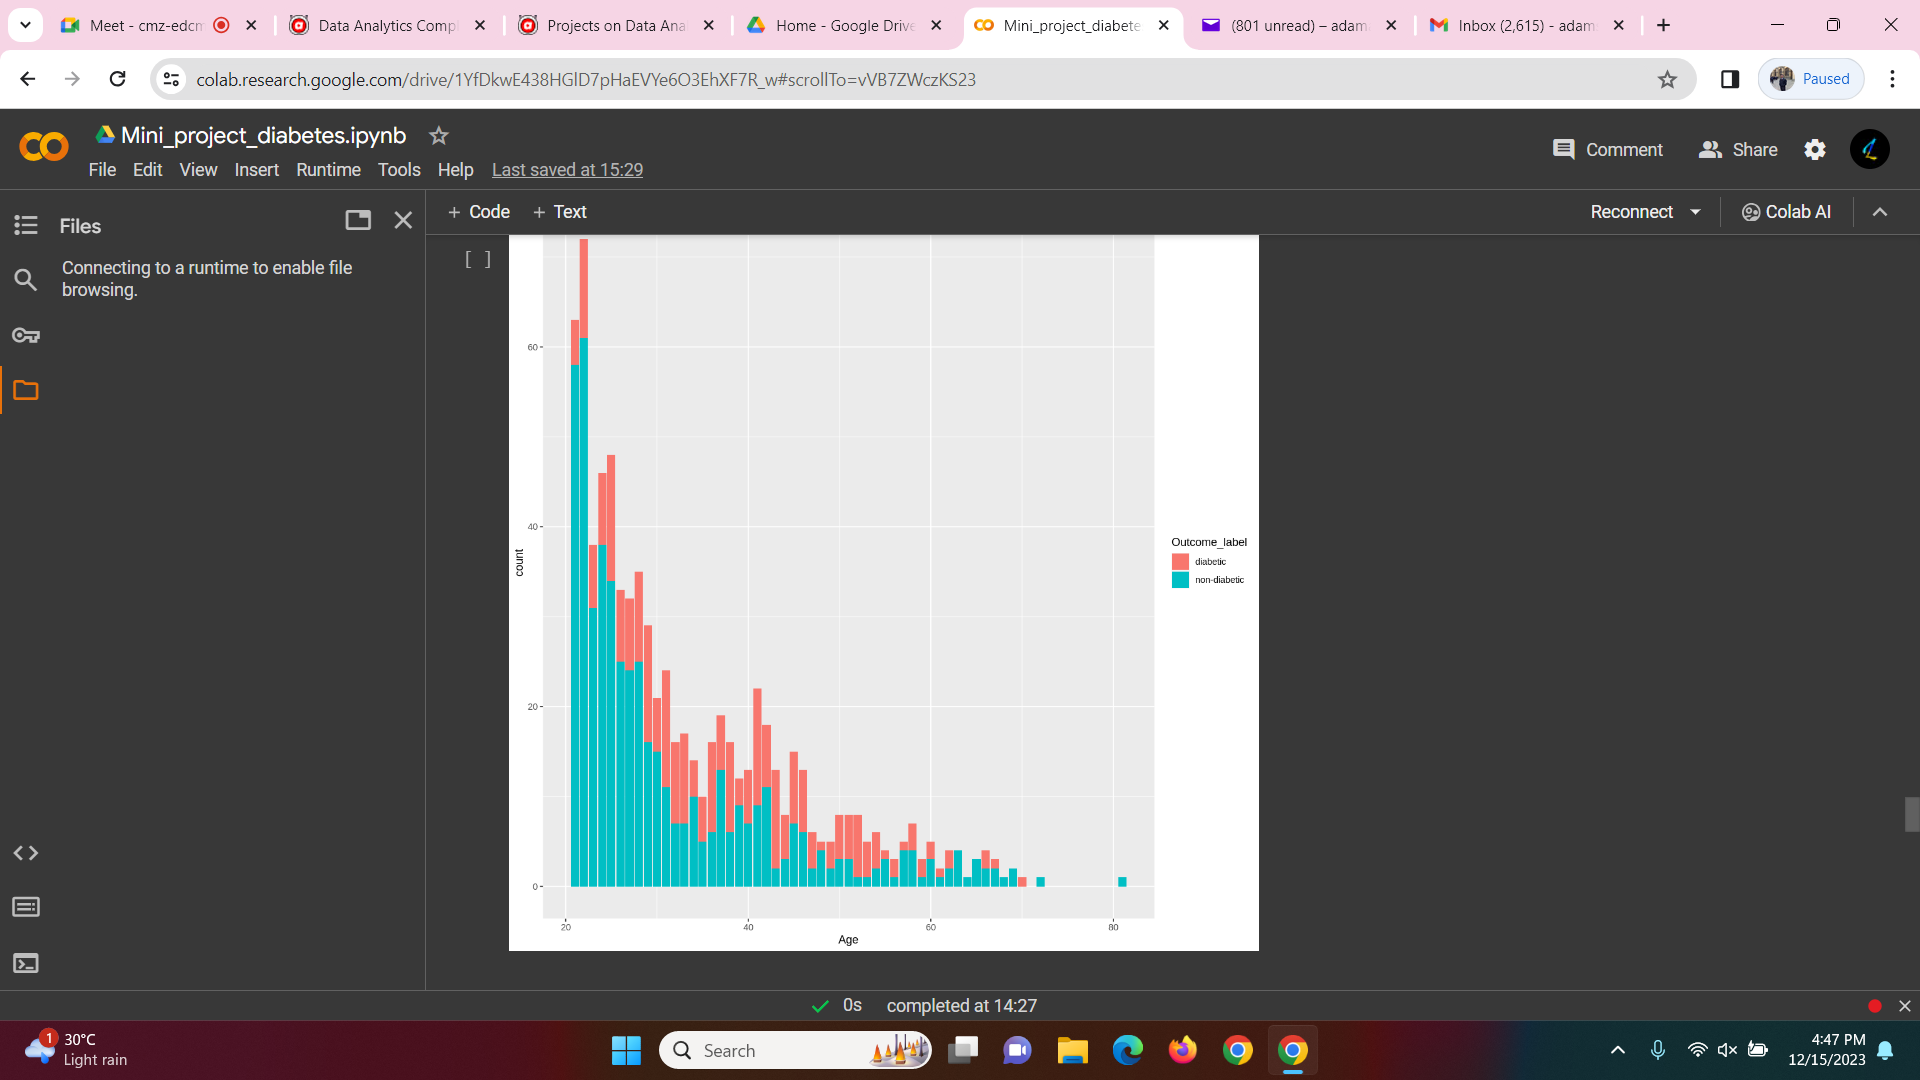
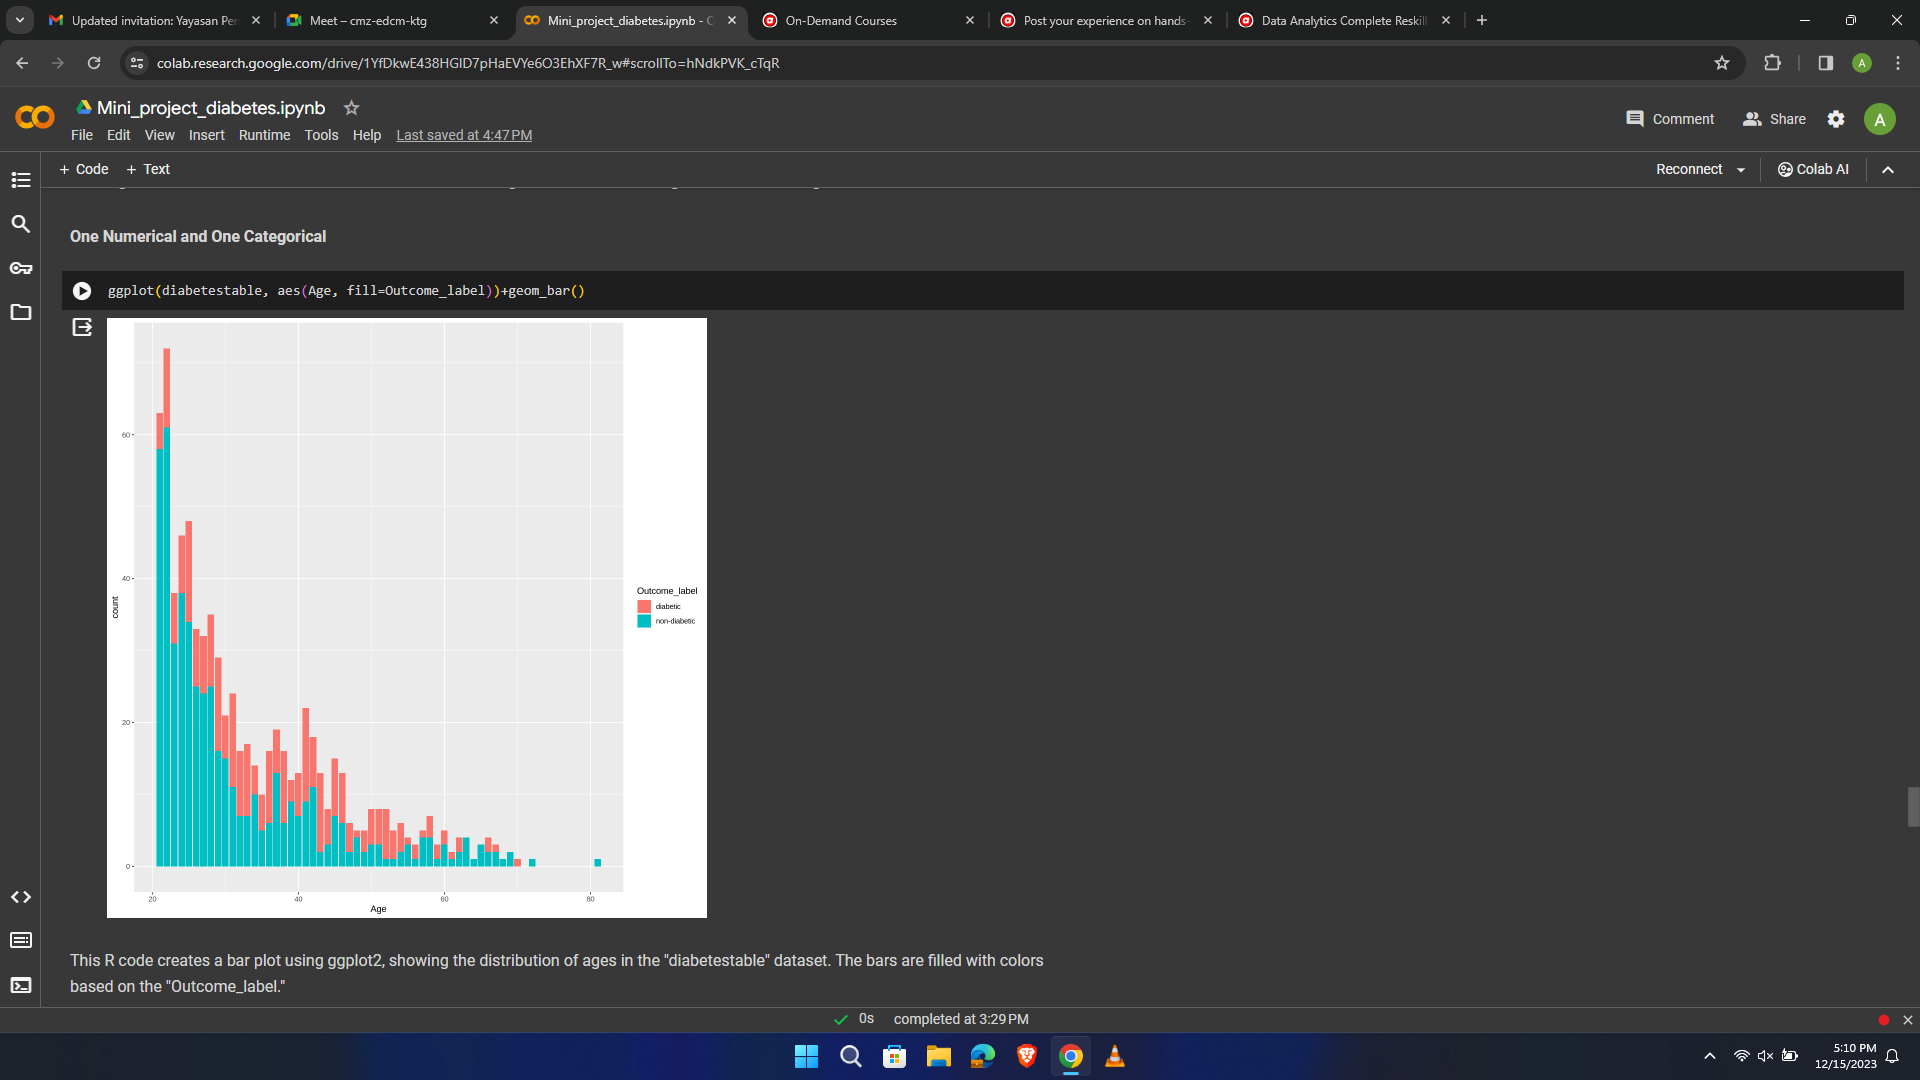
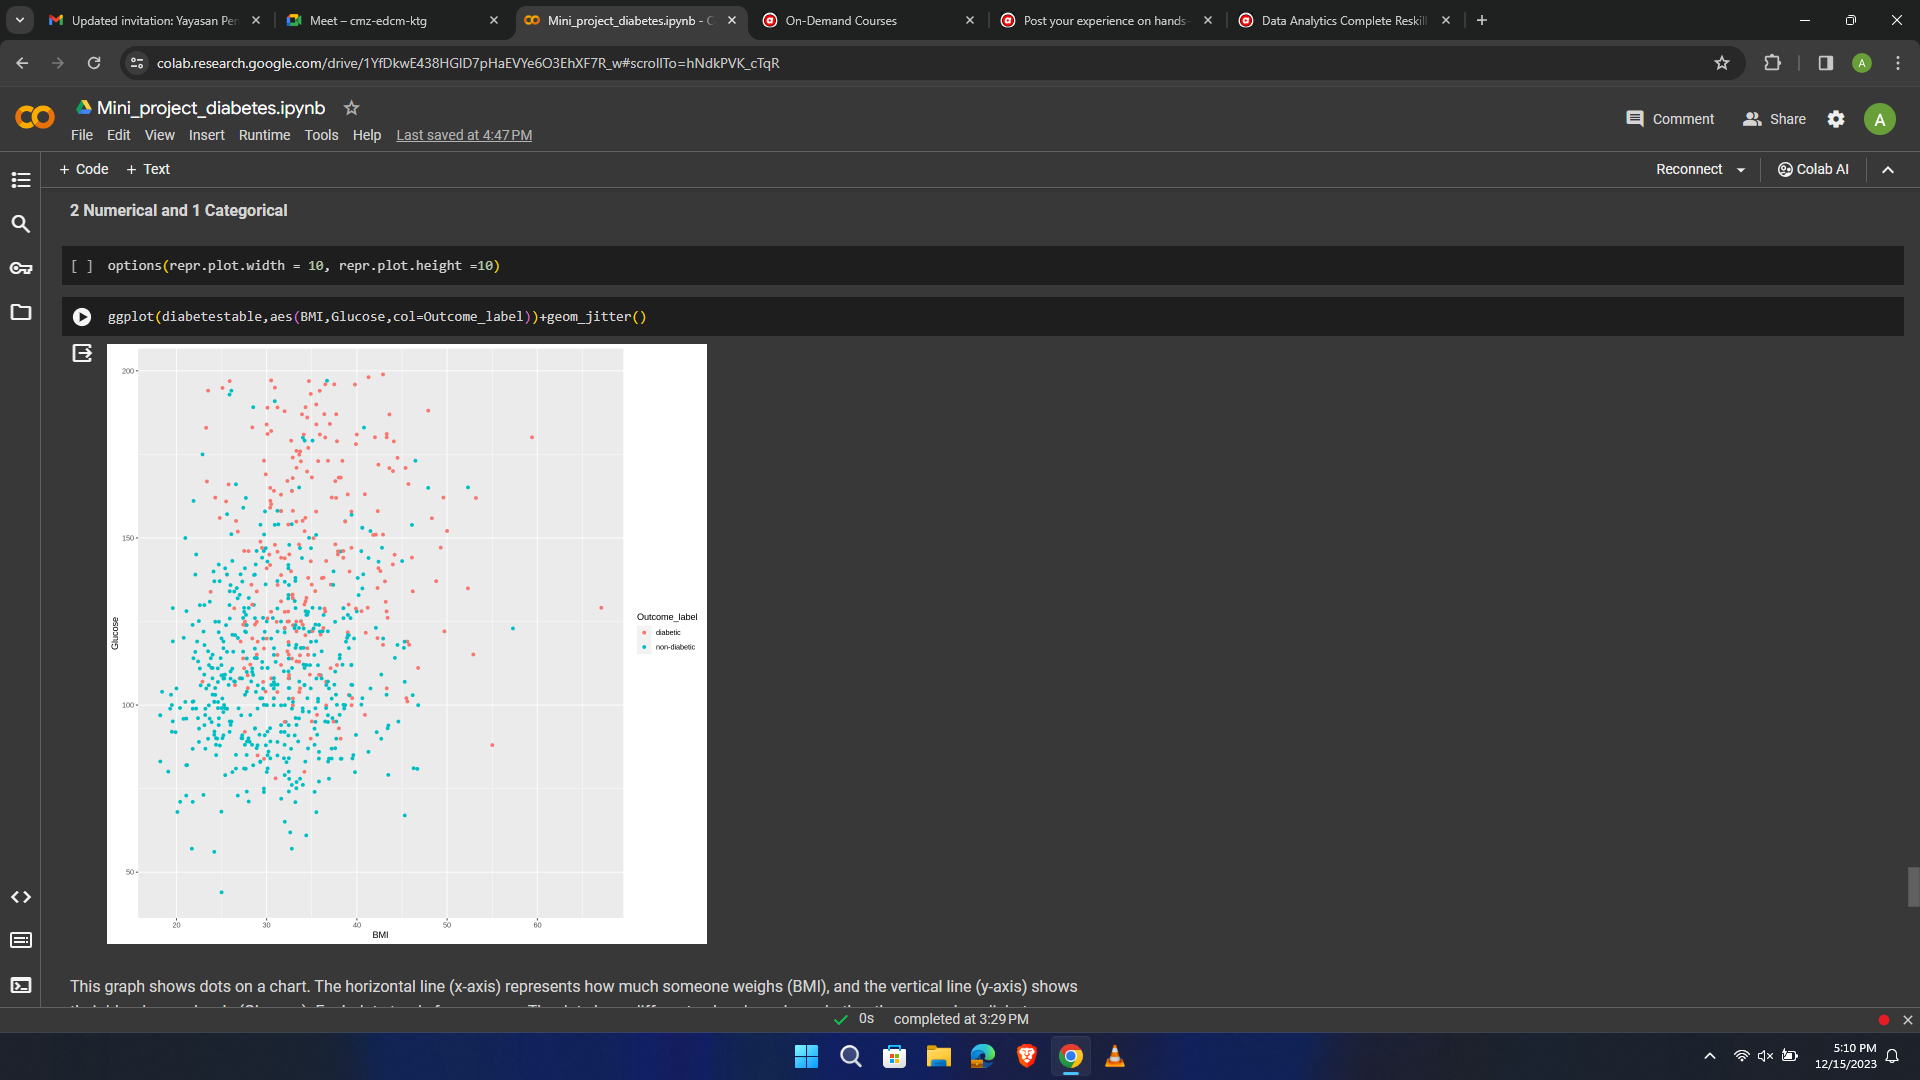
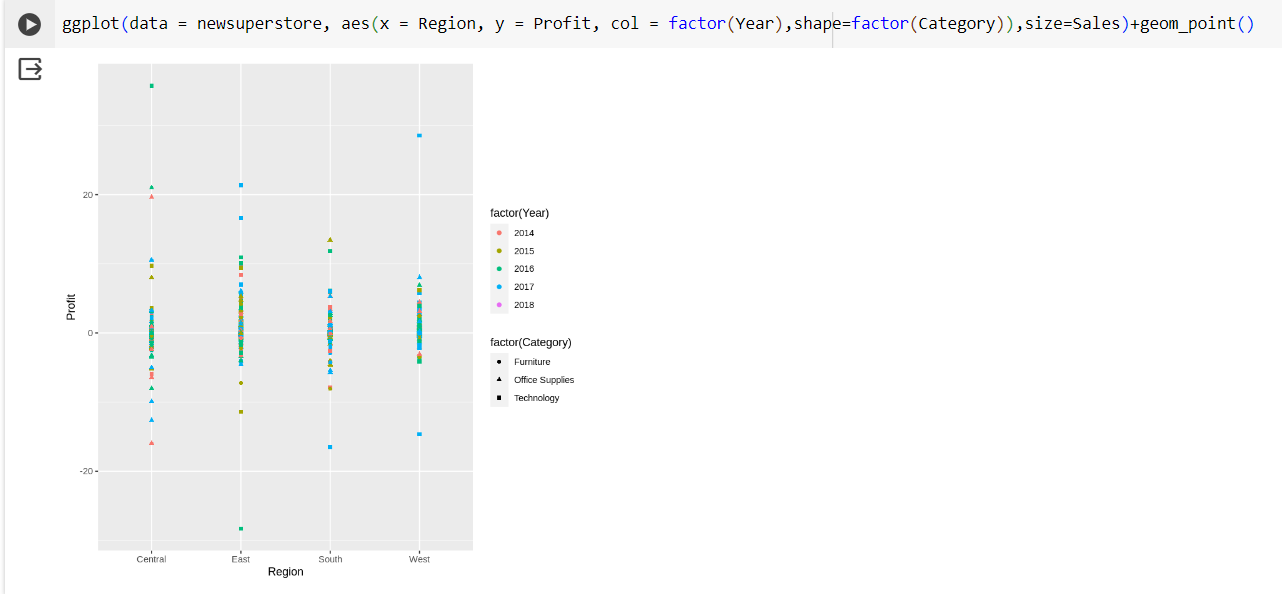
Data Visualization using ggplot
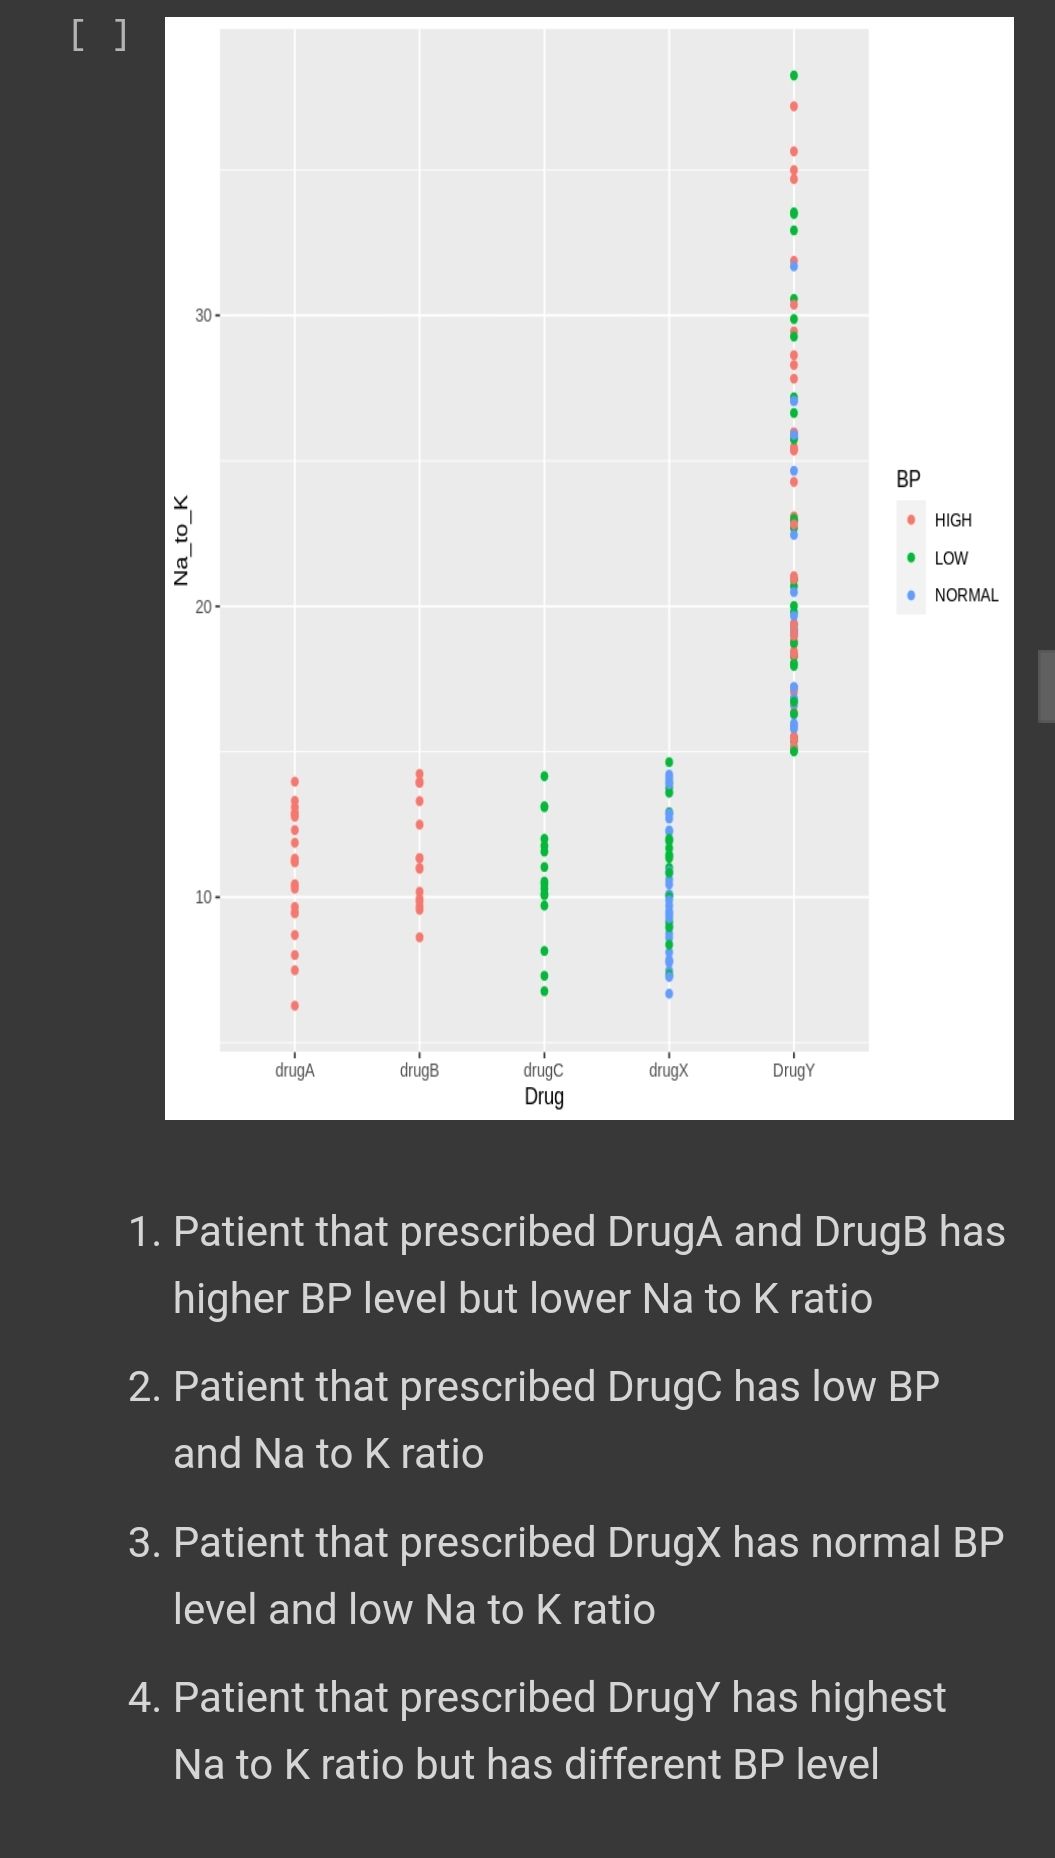
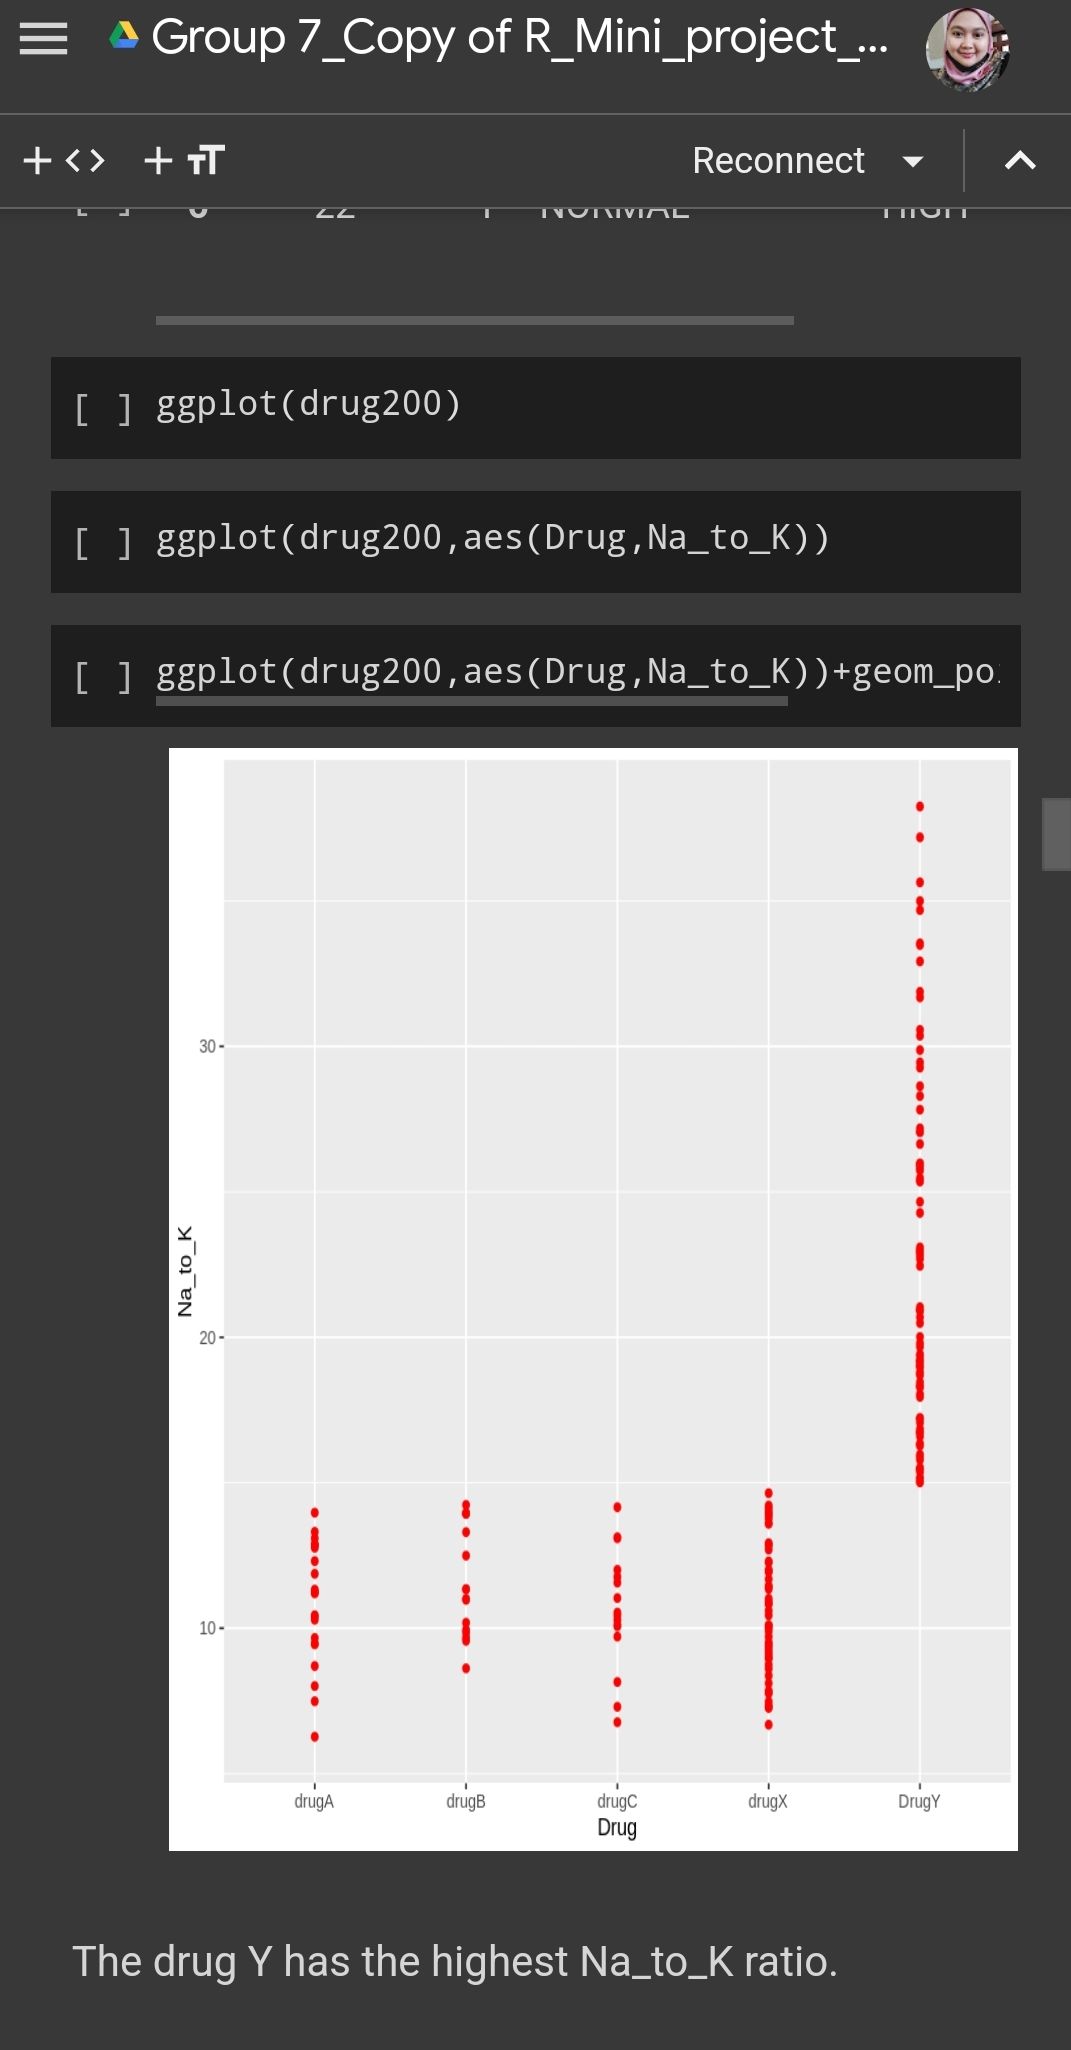
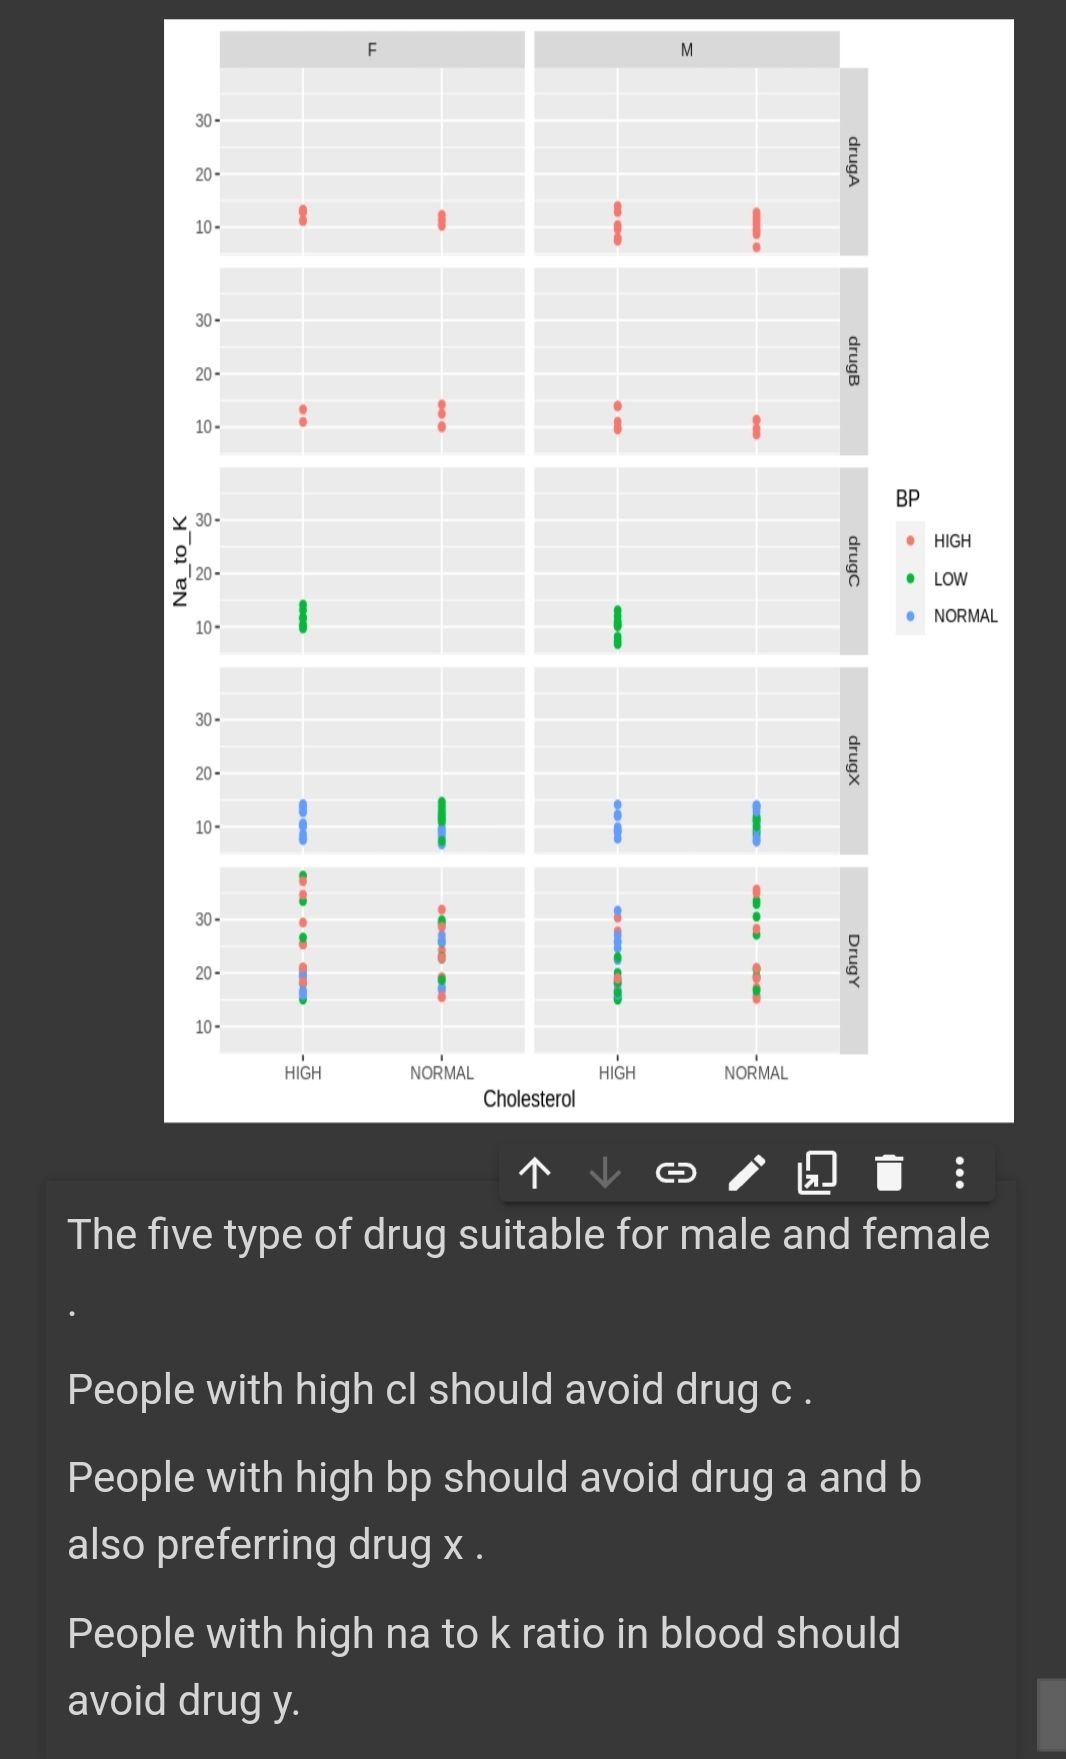
What we can see here is even Drug Y has the highest na to k value but it shows different type of blood pressure level , while Drug A and B shows a high blood pressure level . Its mean there some other factor that affecting the level of blood pressure not necessarily be related to Na to K ratio such as direct psychological effect on heart rate , electrolytes and mineral balance in the body , metabolic process (fluid retention , blood volume ) .
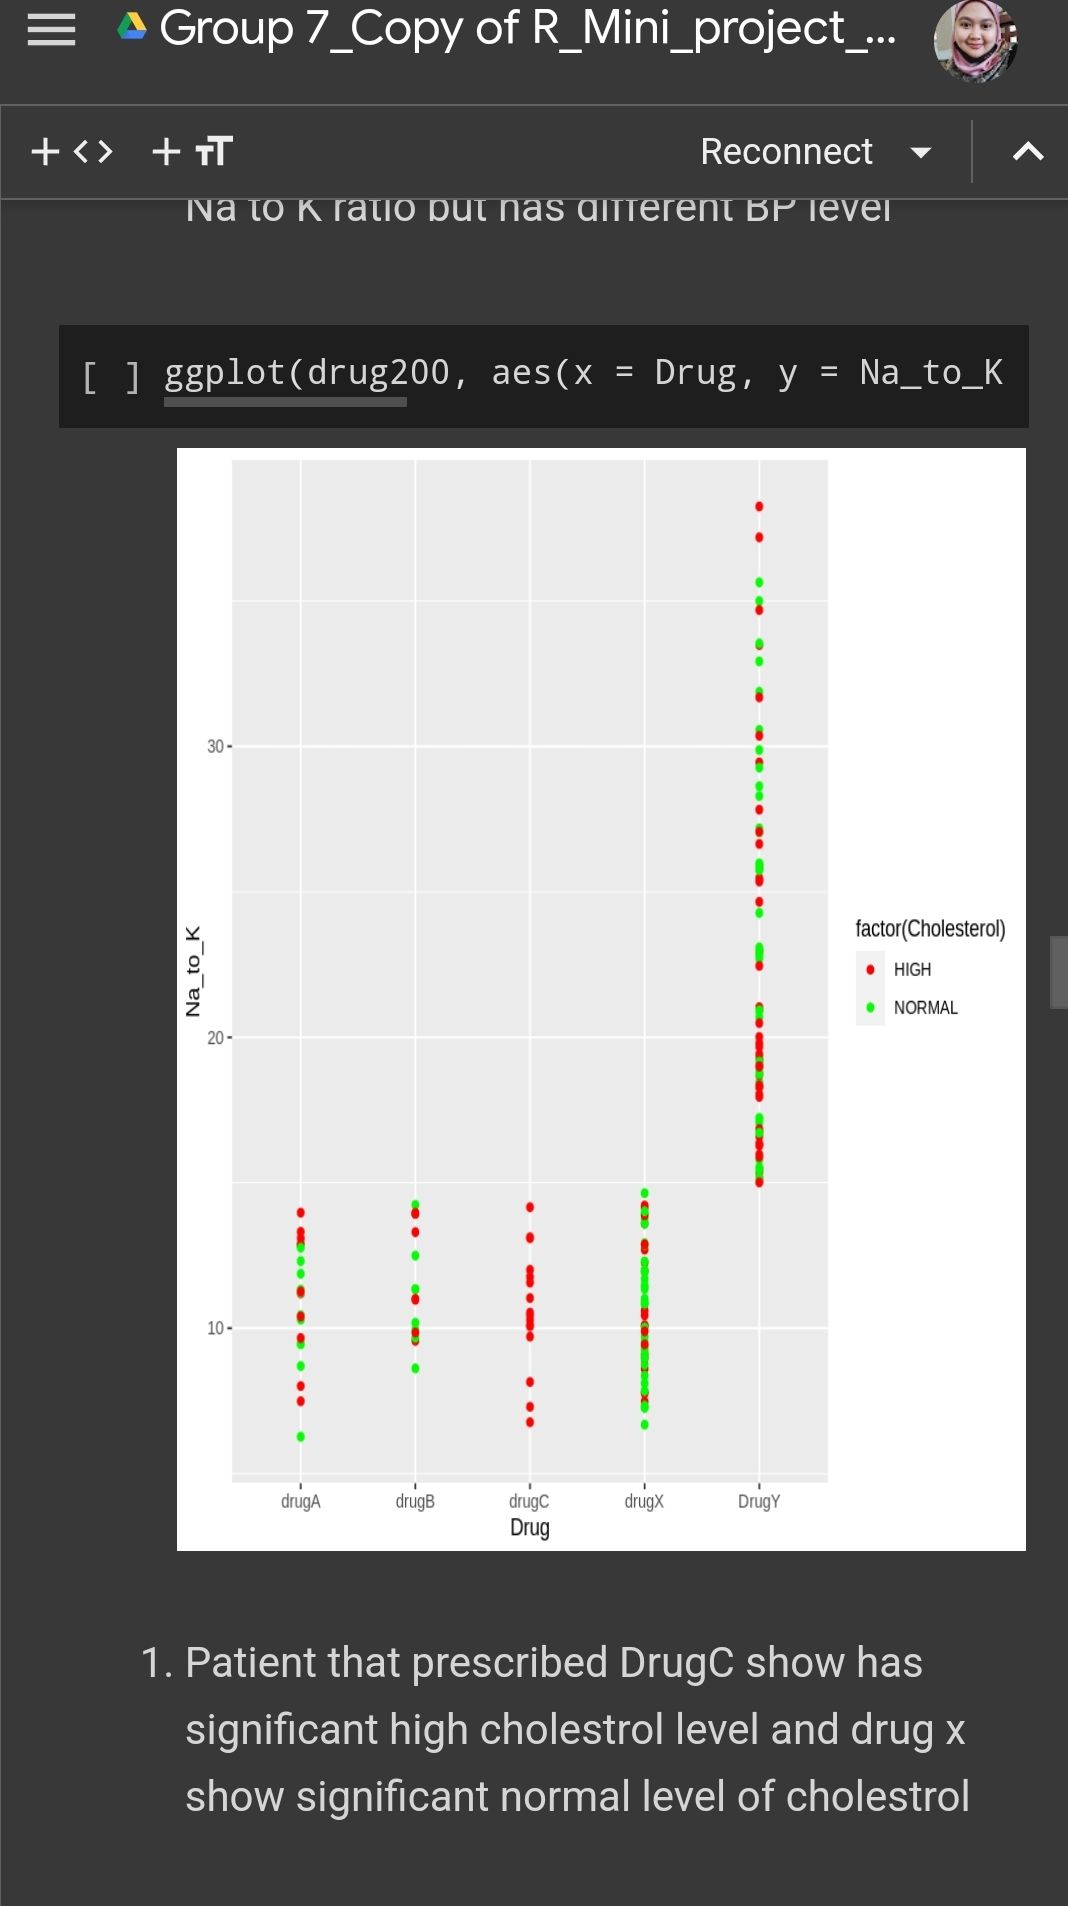
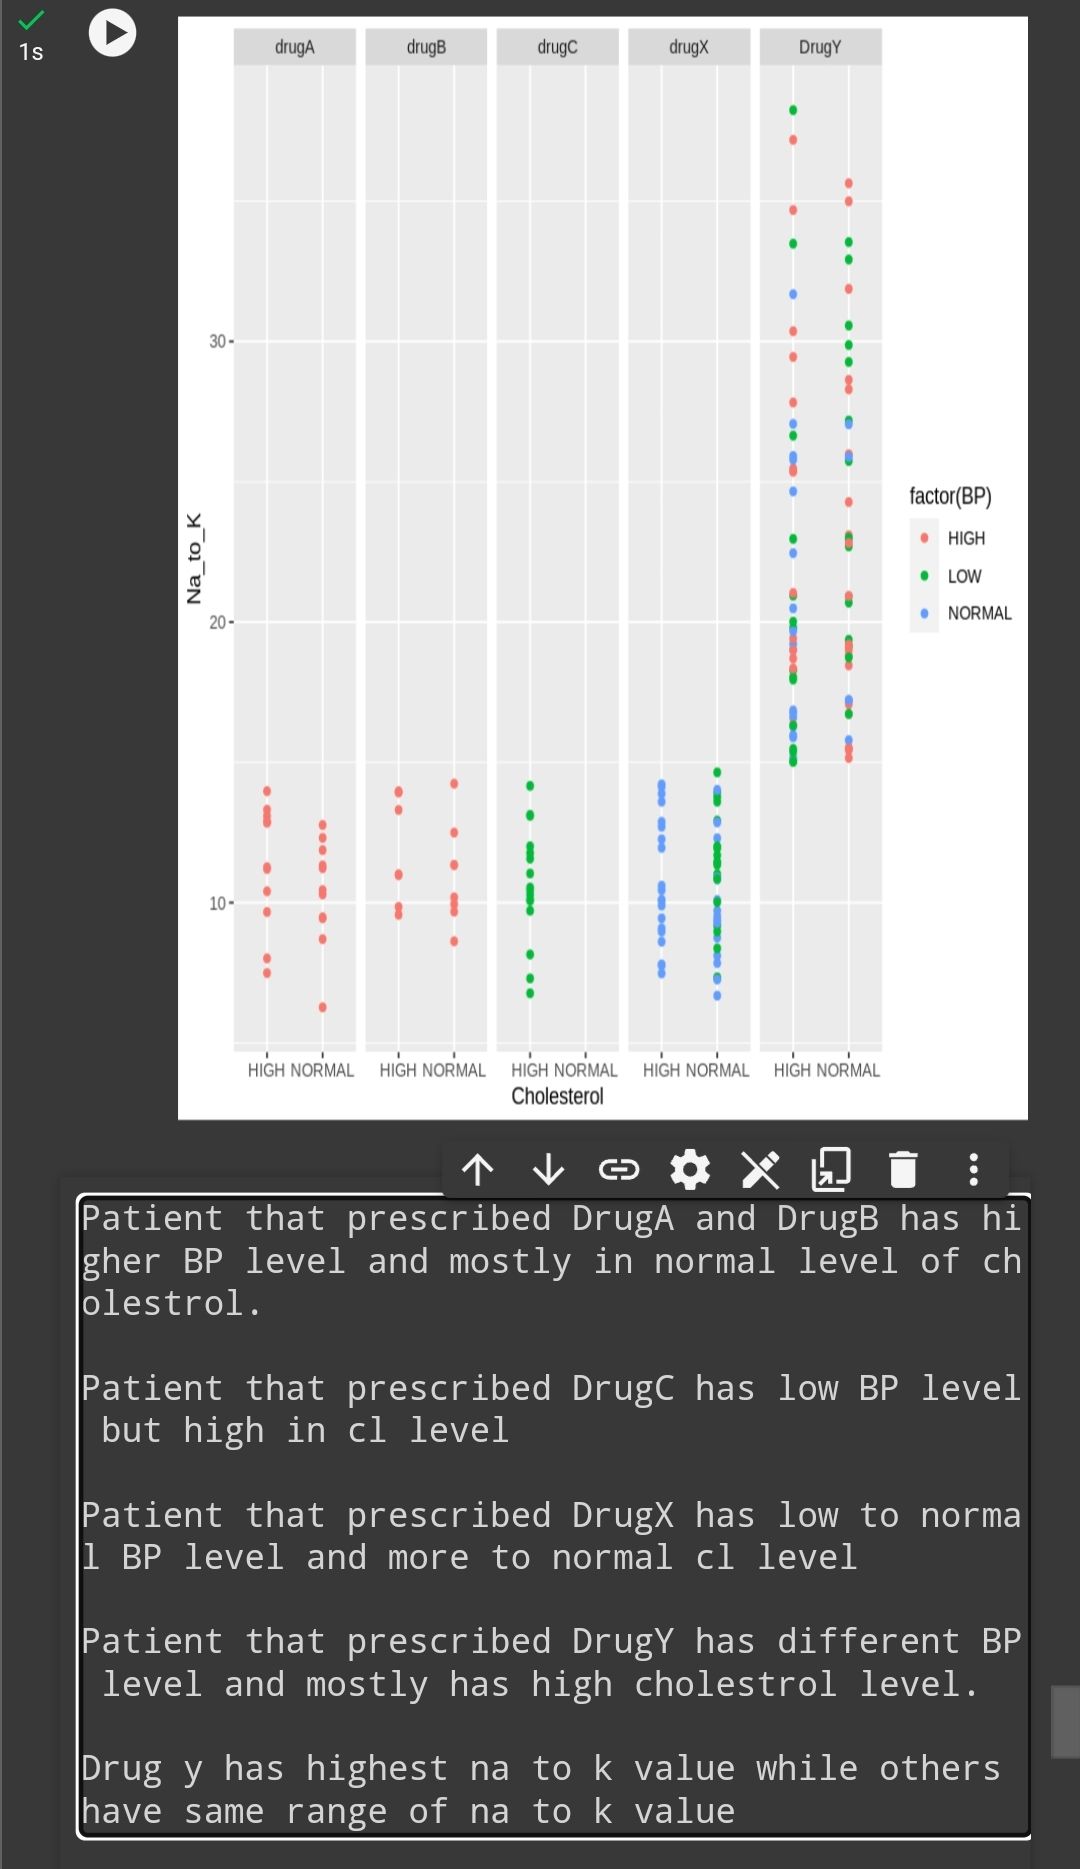
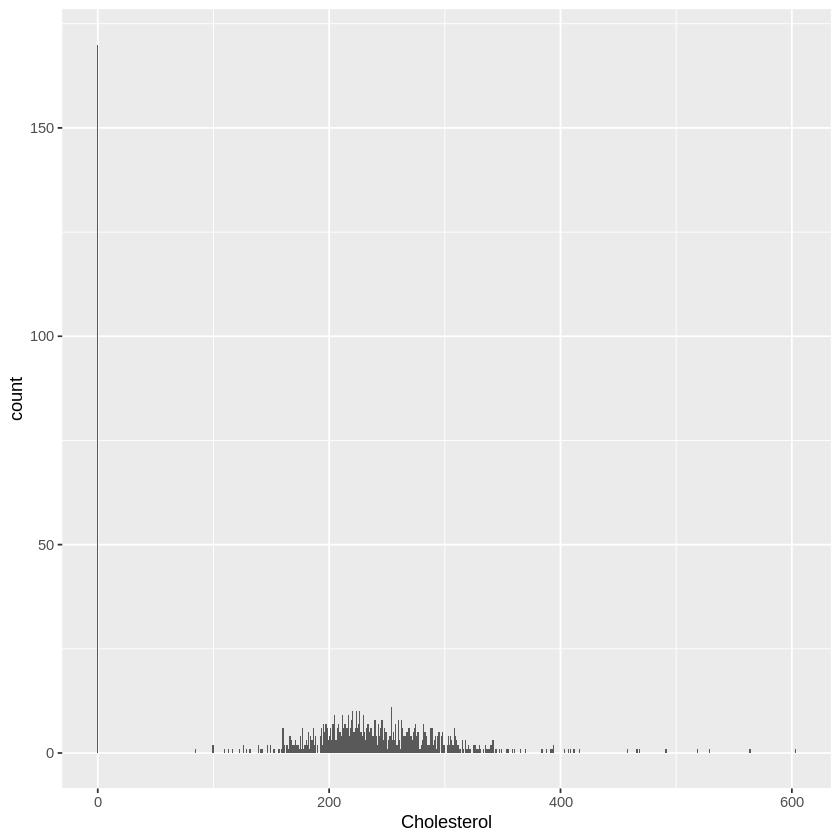
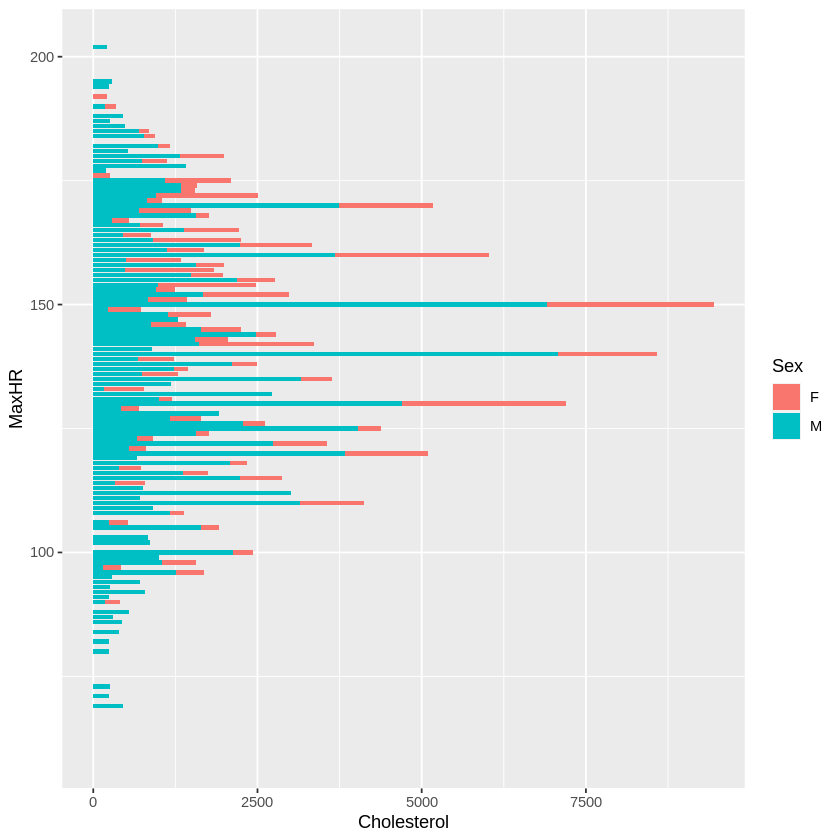
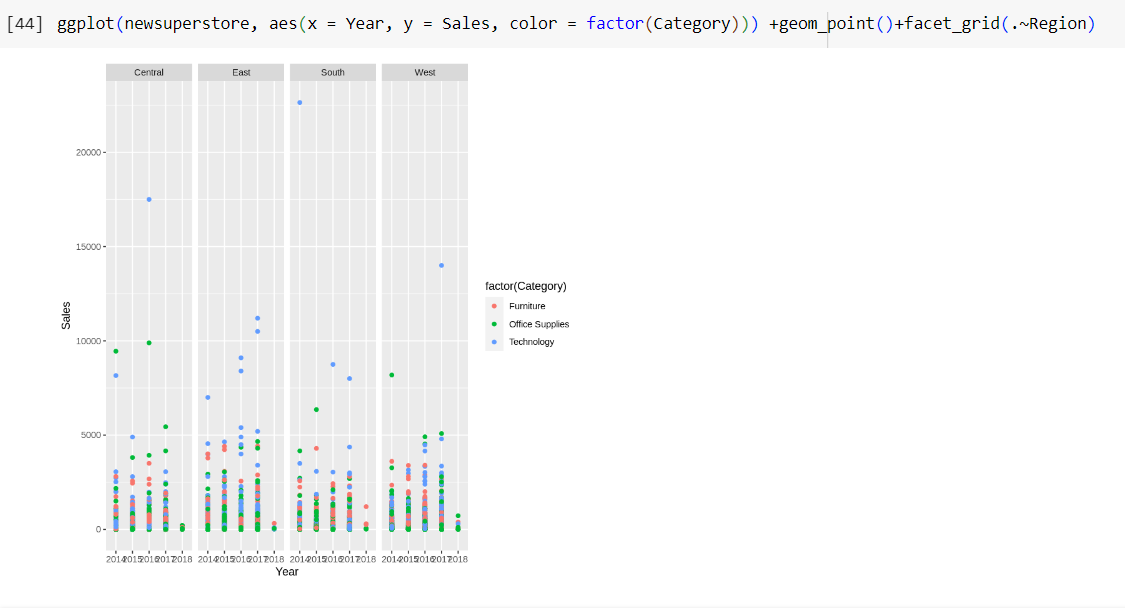
Same case like blood pressure , different drug has different effect towards cholestrol level . From the graph we can see that drug c has significant high level of cholestrol while drug x shows a significant normal level . Both type has lower na to k ratio . This is because certain drugs may have direct effect on lipid metabolism leading to increased cholestrol synthesis or decreased cholestrol clearance .
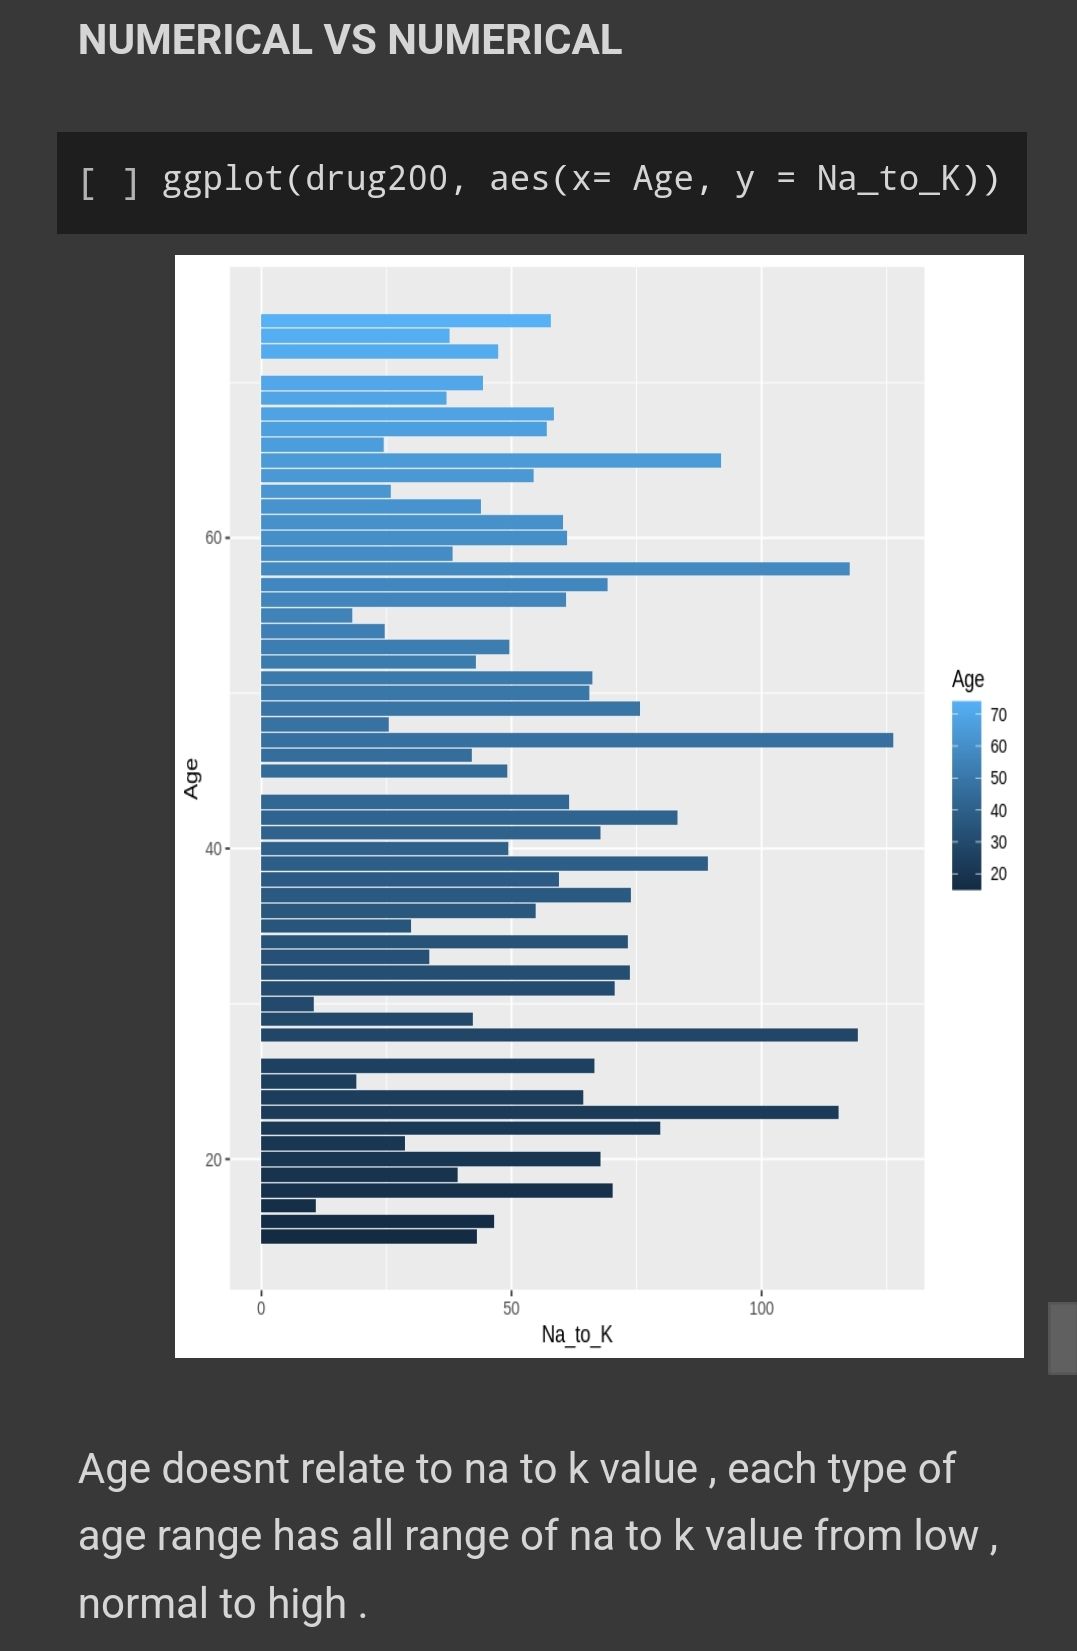
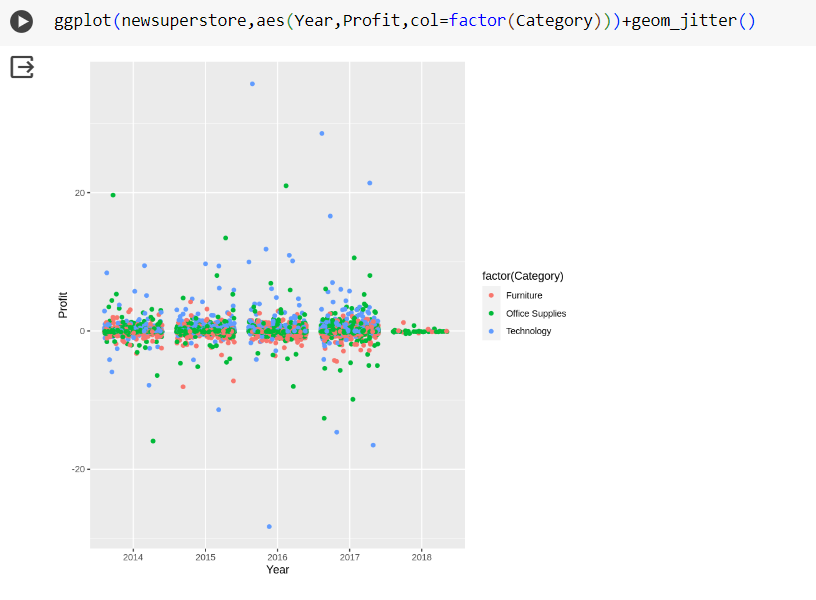
Many other factor to be considered to relate the age with na to k ratio like lifestyle and dietary pattern , genetics and overall health status .
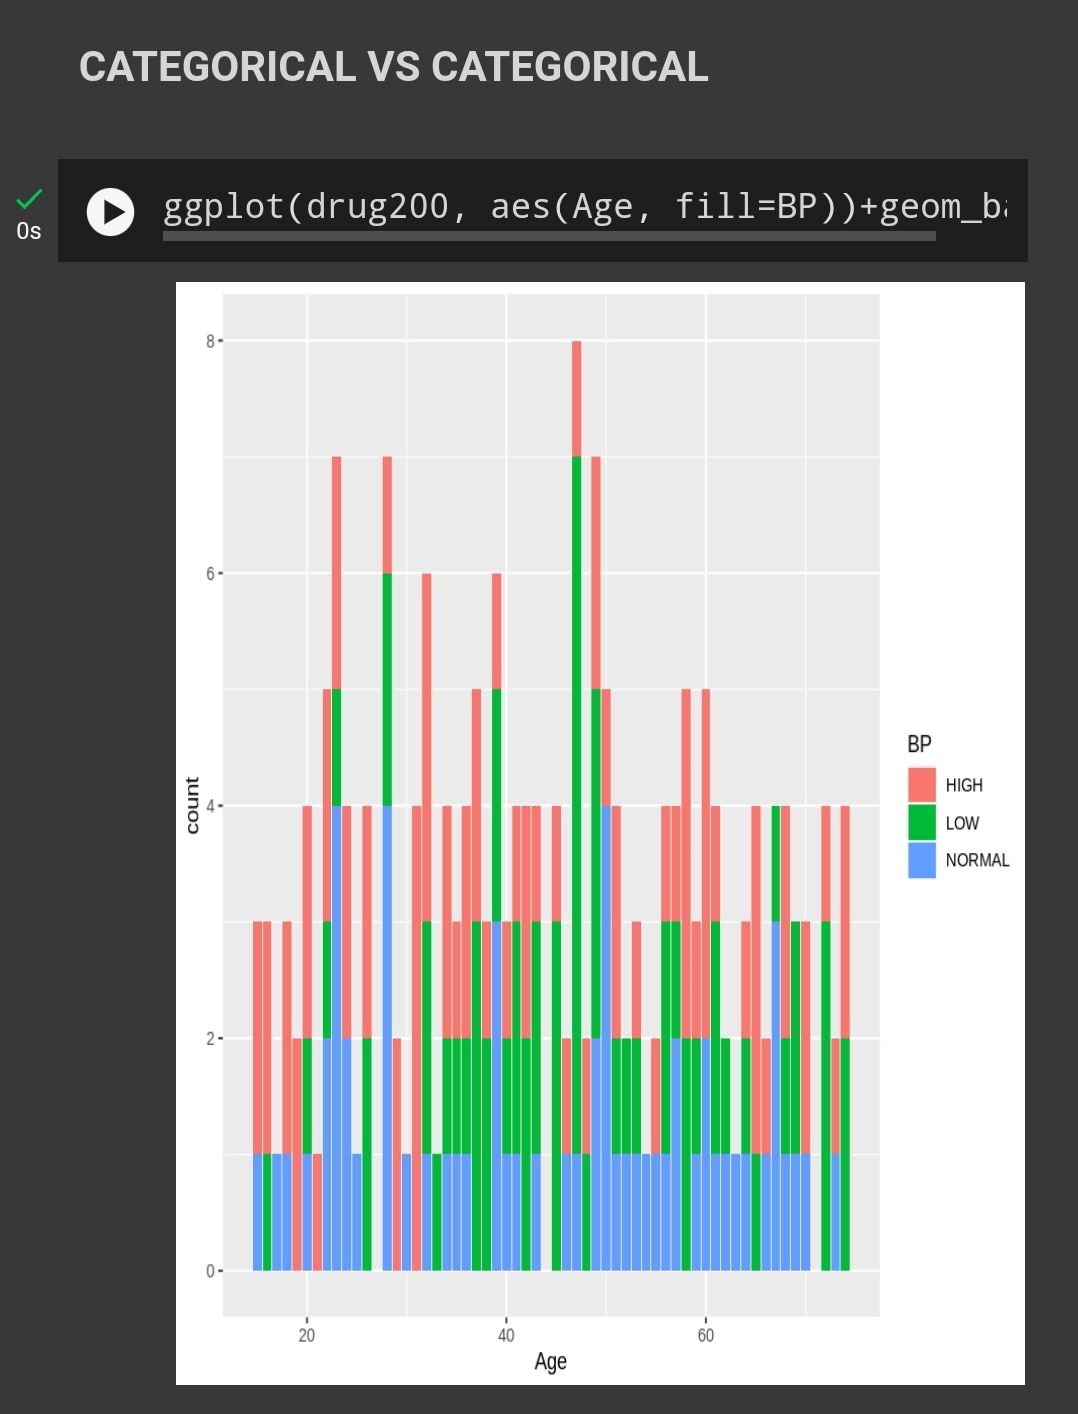
Age Vs BP
Age Vs CL
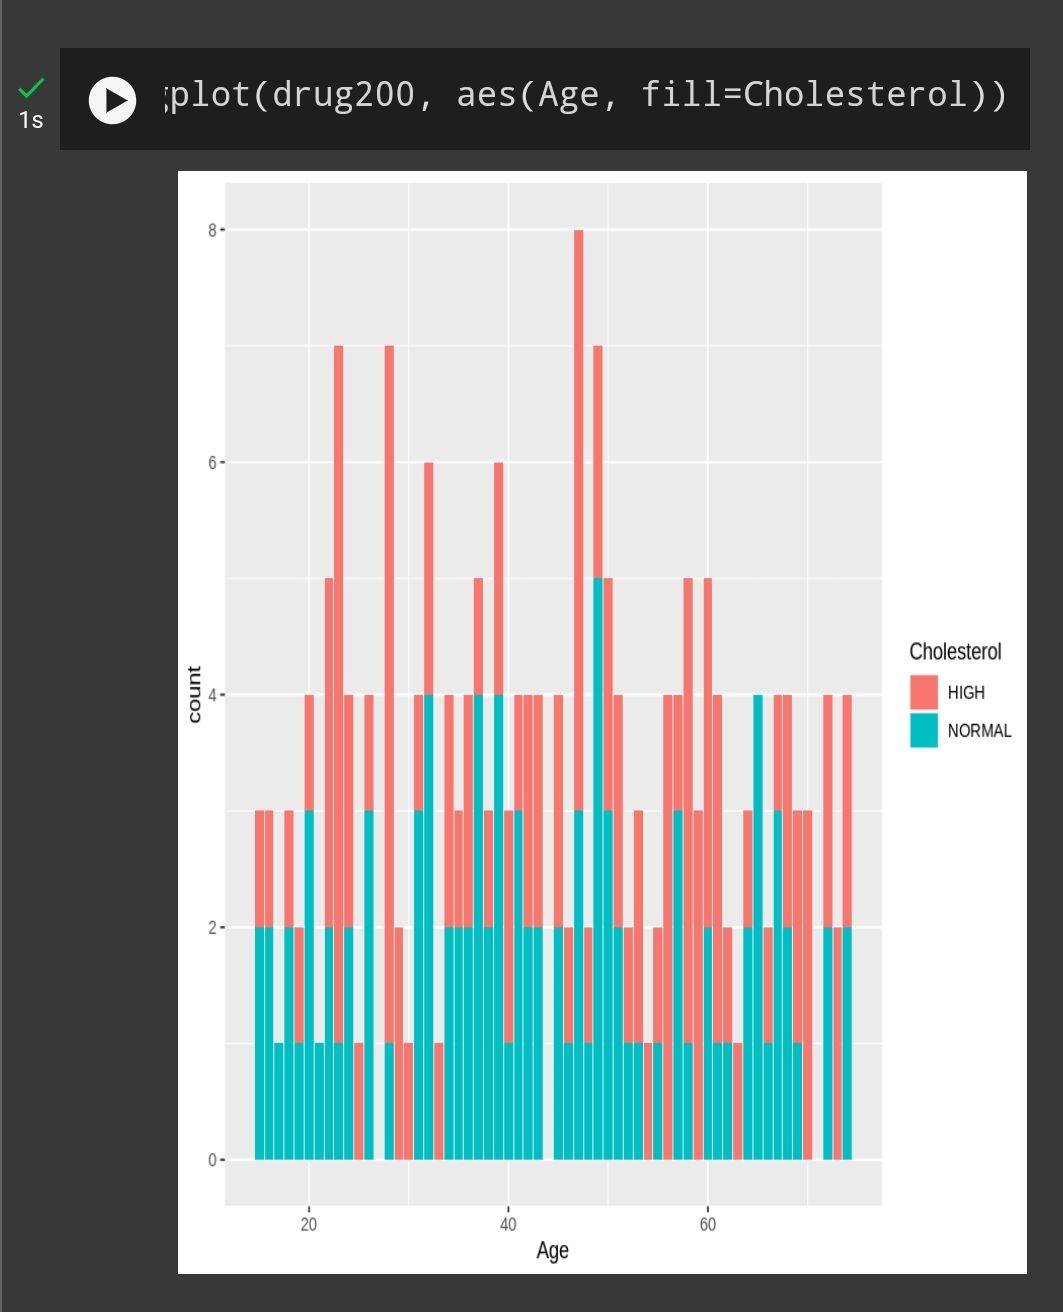
Blood pressure and Cholesterol level doesnt necessarily related to Age
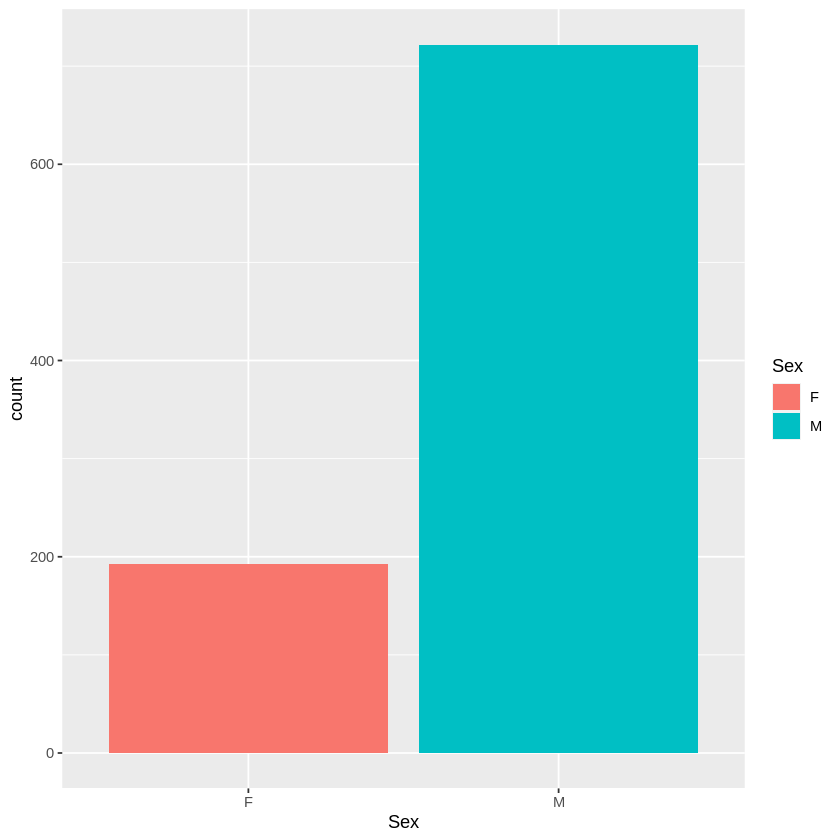
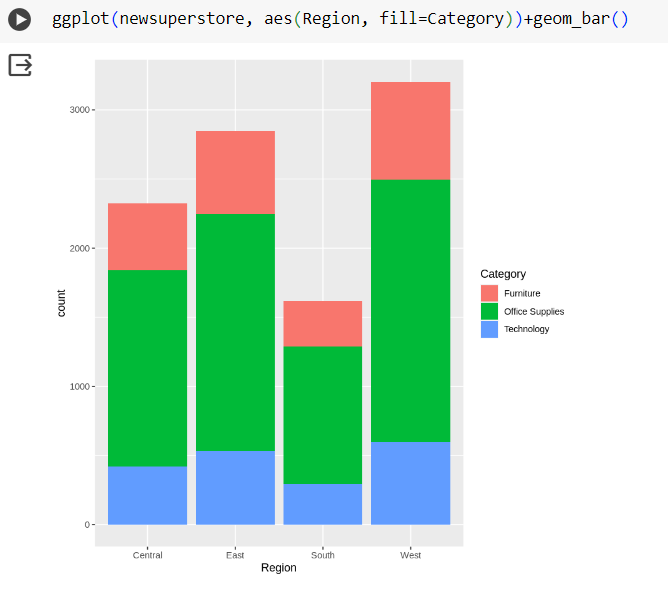
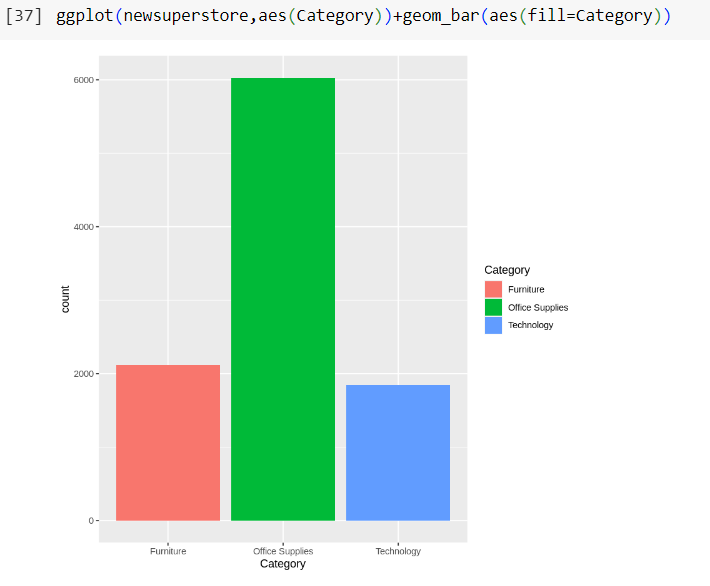
Drug Vs Sex
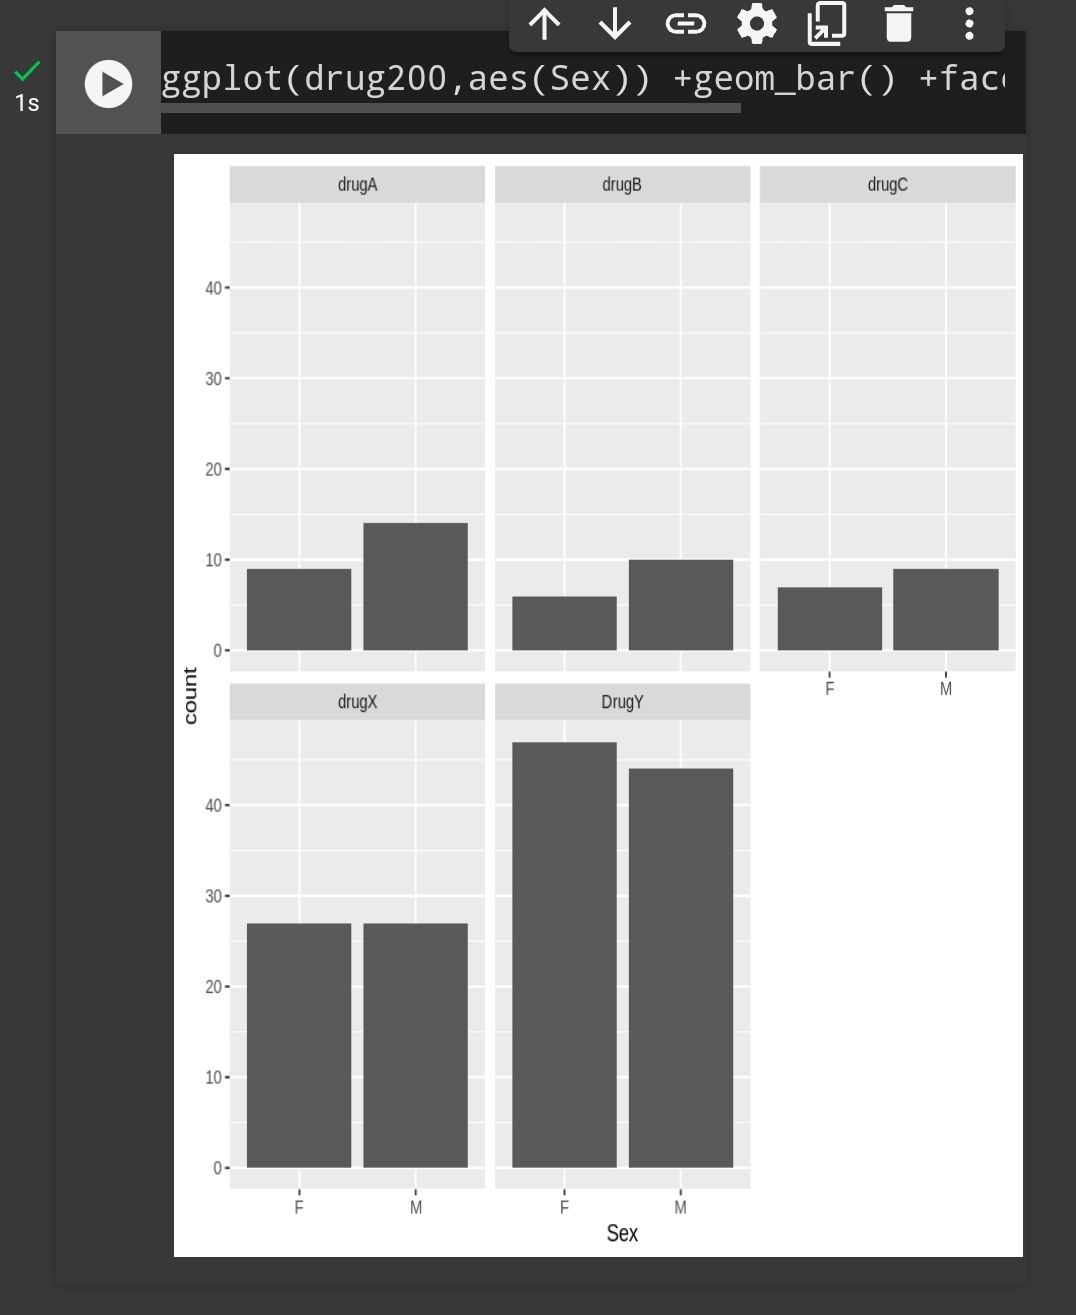
More male taking drug a , b and c
More female taking drug y
While drug x suitable for male and female
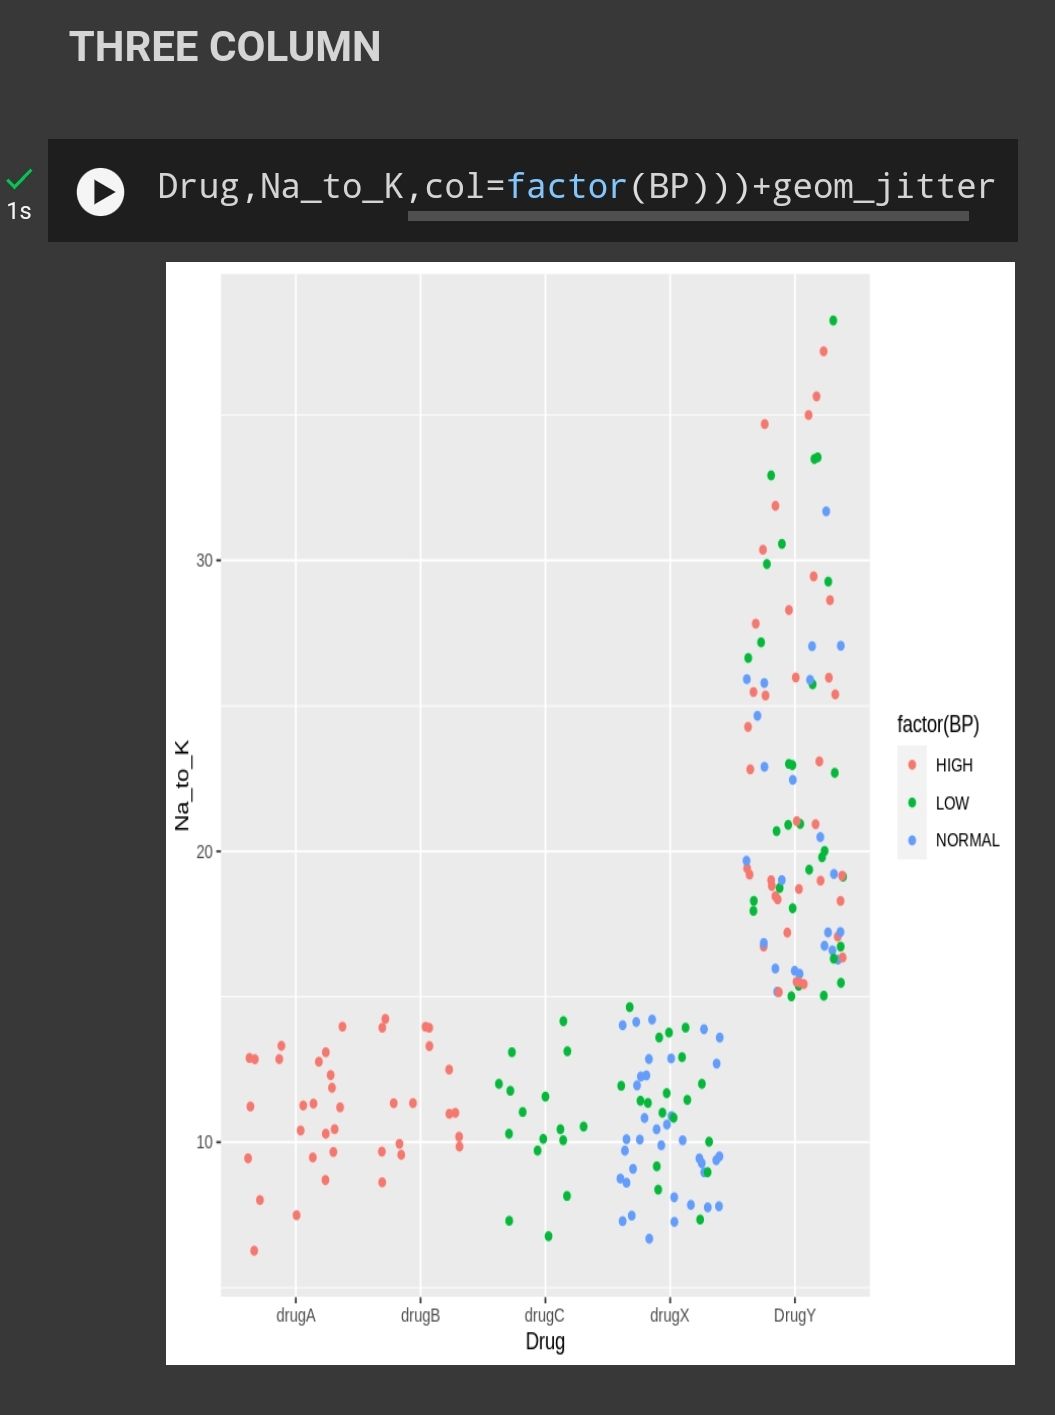
Patient that prescribed DrugA and DrugB has higher BP level but lower Na to K ratio.
Patient that prescribed DrugC has low BP and Na to K ratio.
Patient that prescribed DrugX has normal BP level and low Na to K ratio.
Patient that prescribed DrugY has highest Na to K ratio but has different BP level.
Each type of drug has its effect toward bp , cl and na to k ratio in blood . This data analyze needed by doctor to prescribe the best medication based on individual health status.
Thats all our findings in given dataset about drug classification .
Last but not least , just want to quote some interesting words for my inspiration and all community in data analytics , " Big Data isn't about bits , its about talent " like Dr. Sara always says "BE BOLD "
~ayyinzakaria~
 Dear Participants, Share Your Data Analytics and R Programming Journey!
 Your Experience Matters!


")

 ![alt text]
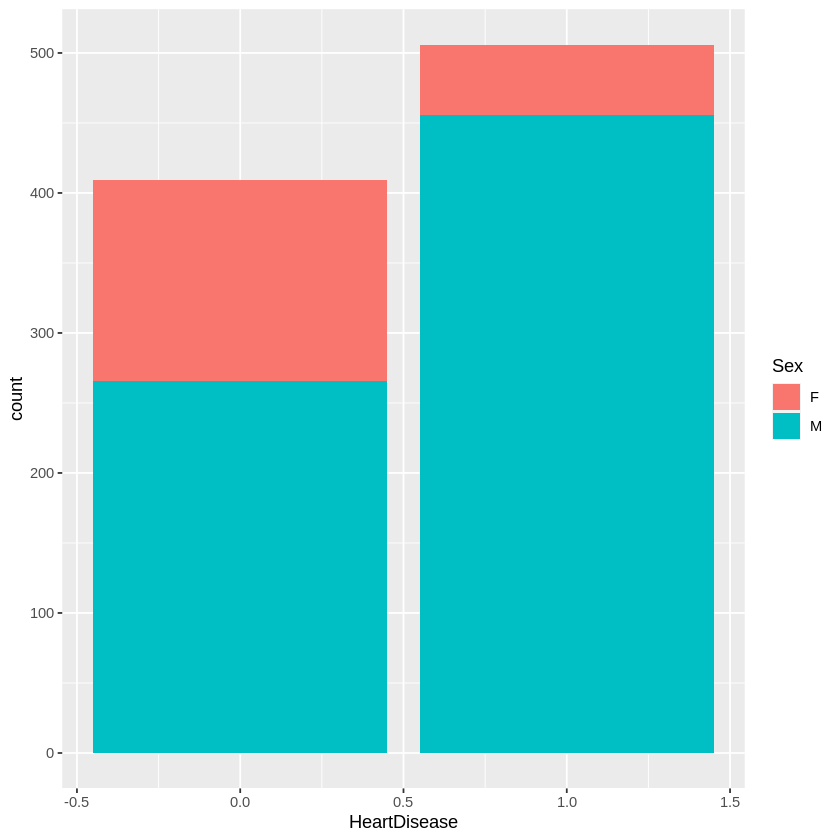
 & Haziq MudZakir
 on an R programming project. The project is about telecom provider churn. This was the first time I heard the term "Churn," and it has given me a rollercoaster ride because I need to complete the job. Nevertheless, in a little amount of time, we were able to exceed the presentation. This is our video presentation on the churn dataset analysis and a few sample visualizations that we managed to create.